Quarantined tests page
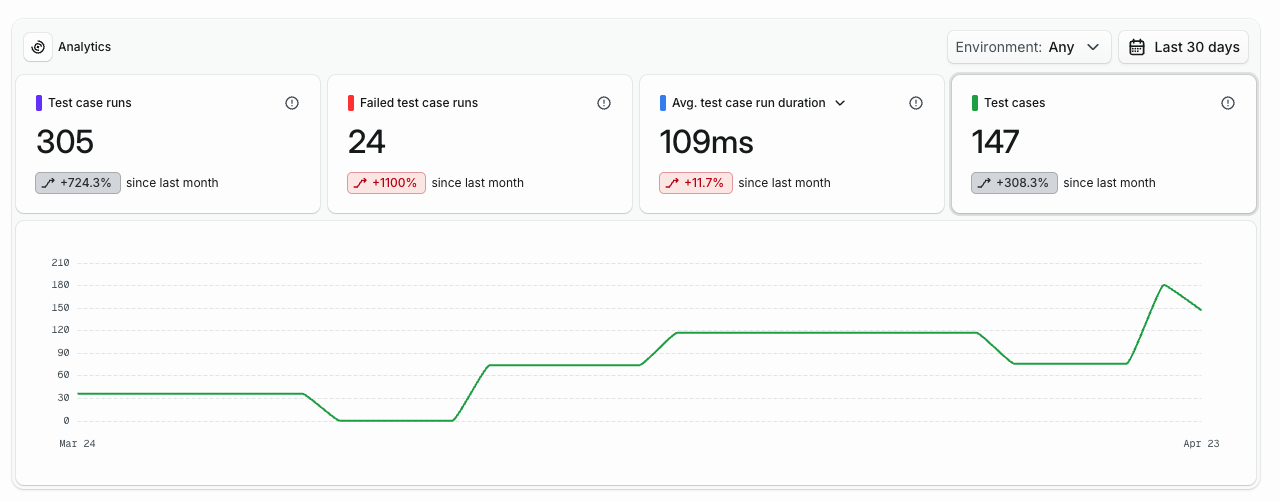
View all quarantined tests in your project at a glance. The new page shows analytics tracking the number of quarantined tests over time, and a searchable table with filtering options.
Track the complete history of state changes for each test case. The new Test History tab shows a timeline of events including when a test was first seen, when it was marked or unmarked as flaky, and when it was quarantined or unquarantined. Each event shows who made the change - whether it was done manually by a team member or automatically by Tuist.
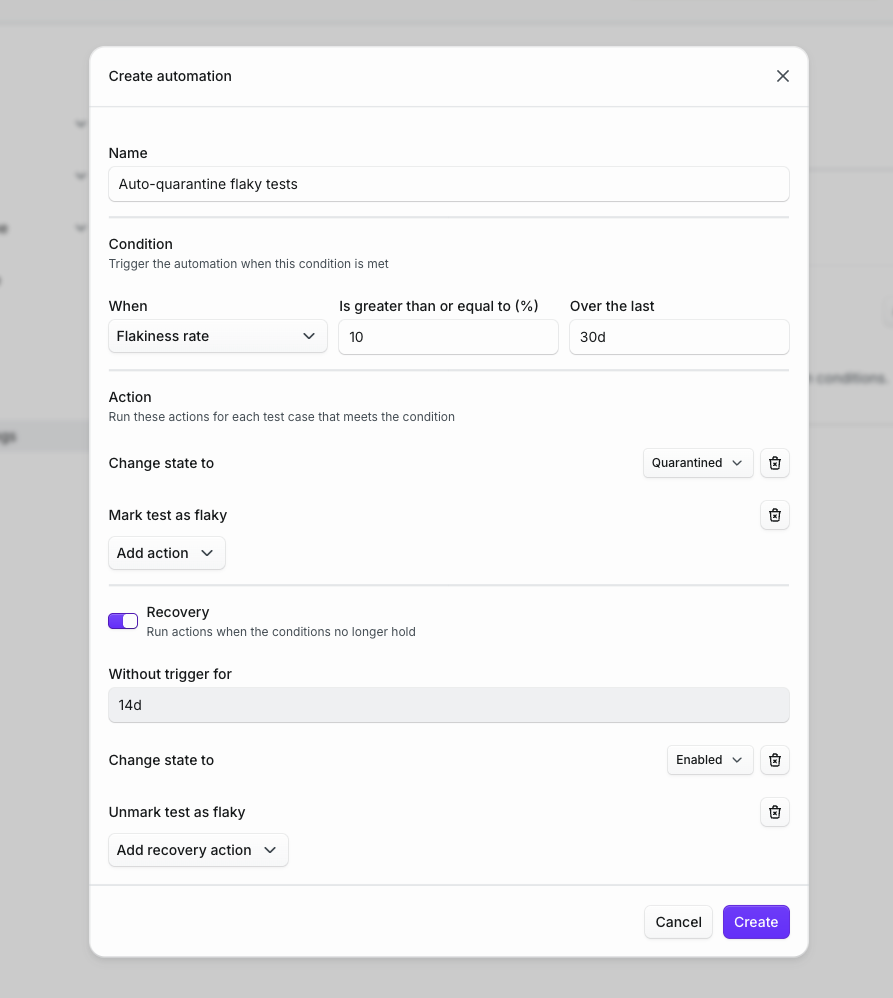
Quarantine flaky tests to prevent them from blocking your CI pipeline. Tests can be automatically quarantined when marked as flaky, or manually quarantined from the test case detail page. Skip quarantined tests by running xcodebuild test $(tuist test case list --skip-testing).
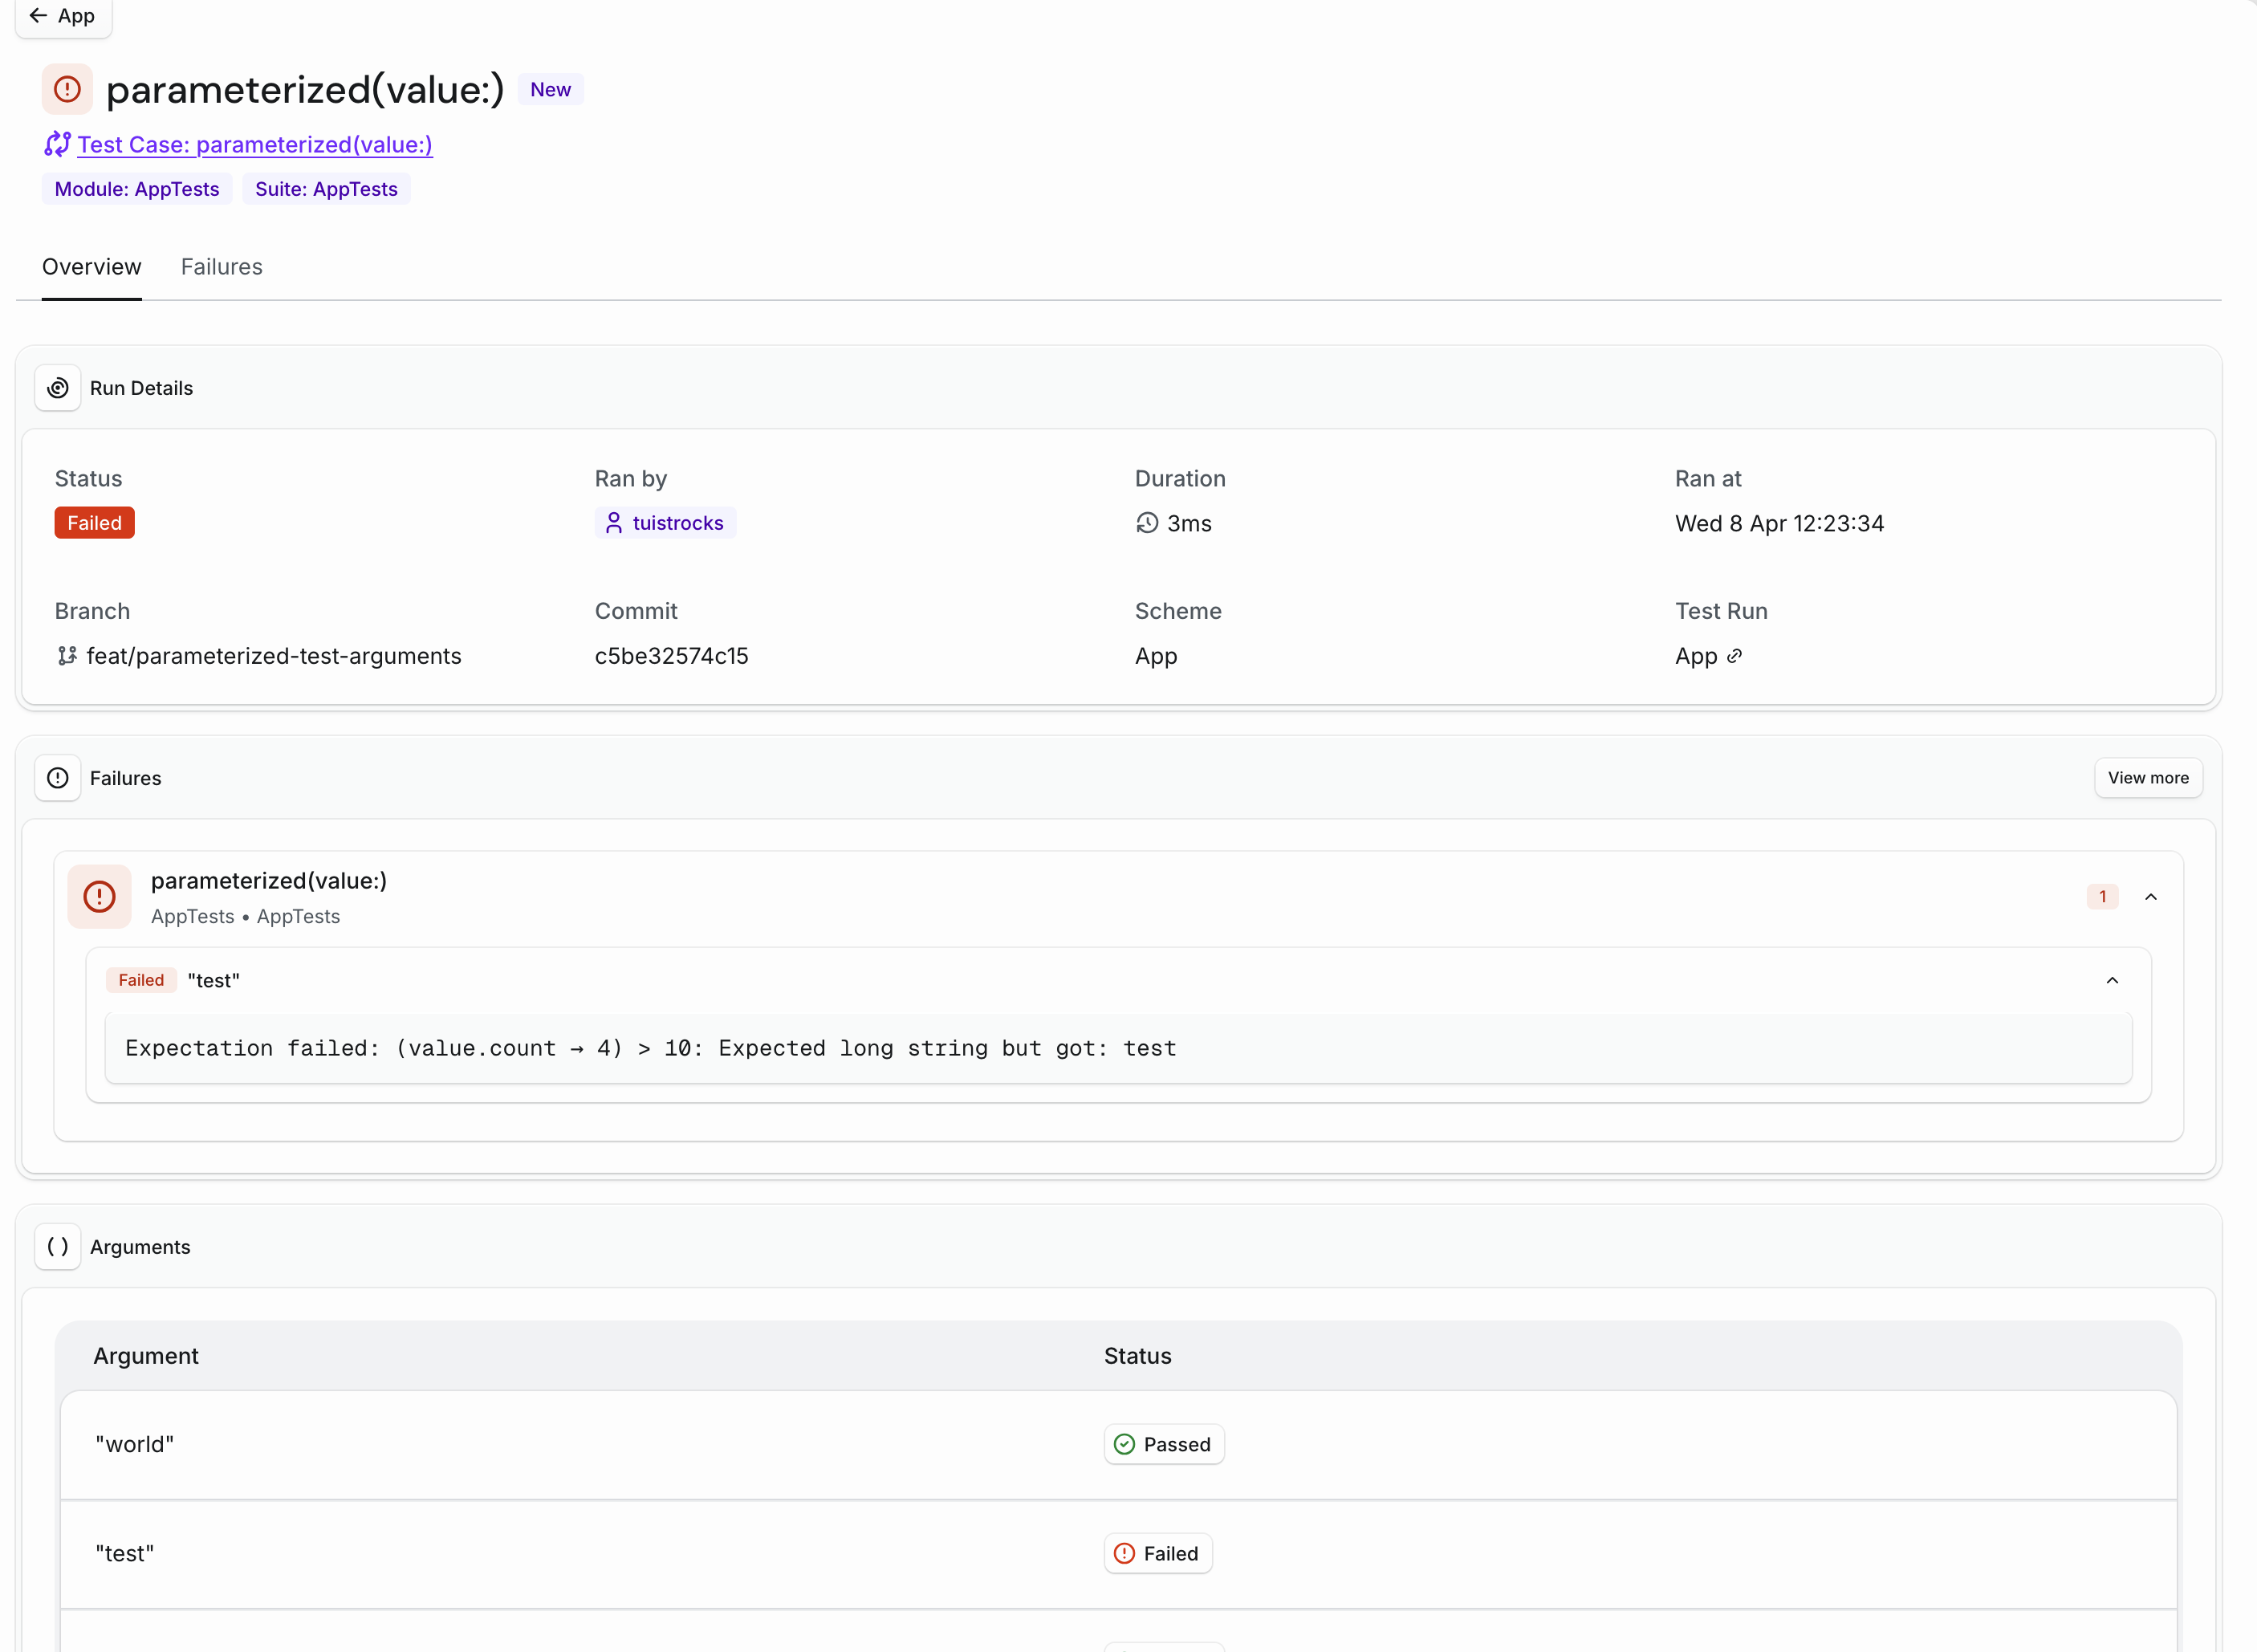
Tuist now marks test cases as "New" when they haven't been seen in CI on your project's default branch before.
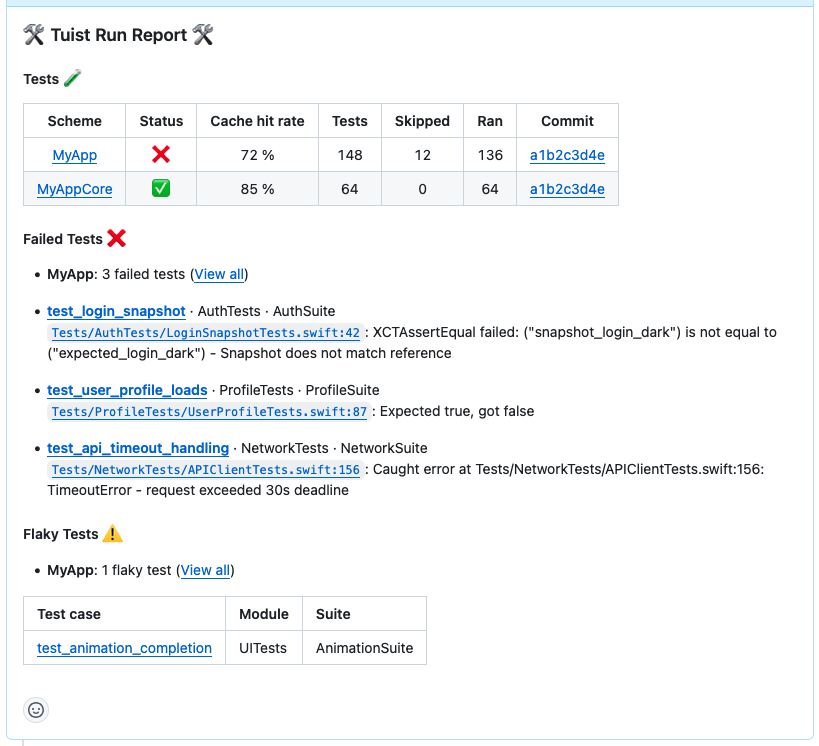
Flaky tests detected during your CI runs are now surfaced directly in Tuist's pull request comments. The new "Flaky Tests" section shows a summary of flaky tests per test scheme with a link to view all flaky runs. This makes it easier to spot and address flaky tests without leaving your pull request.
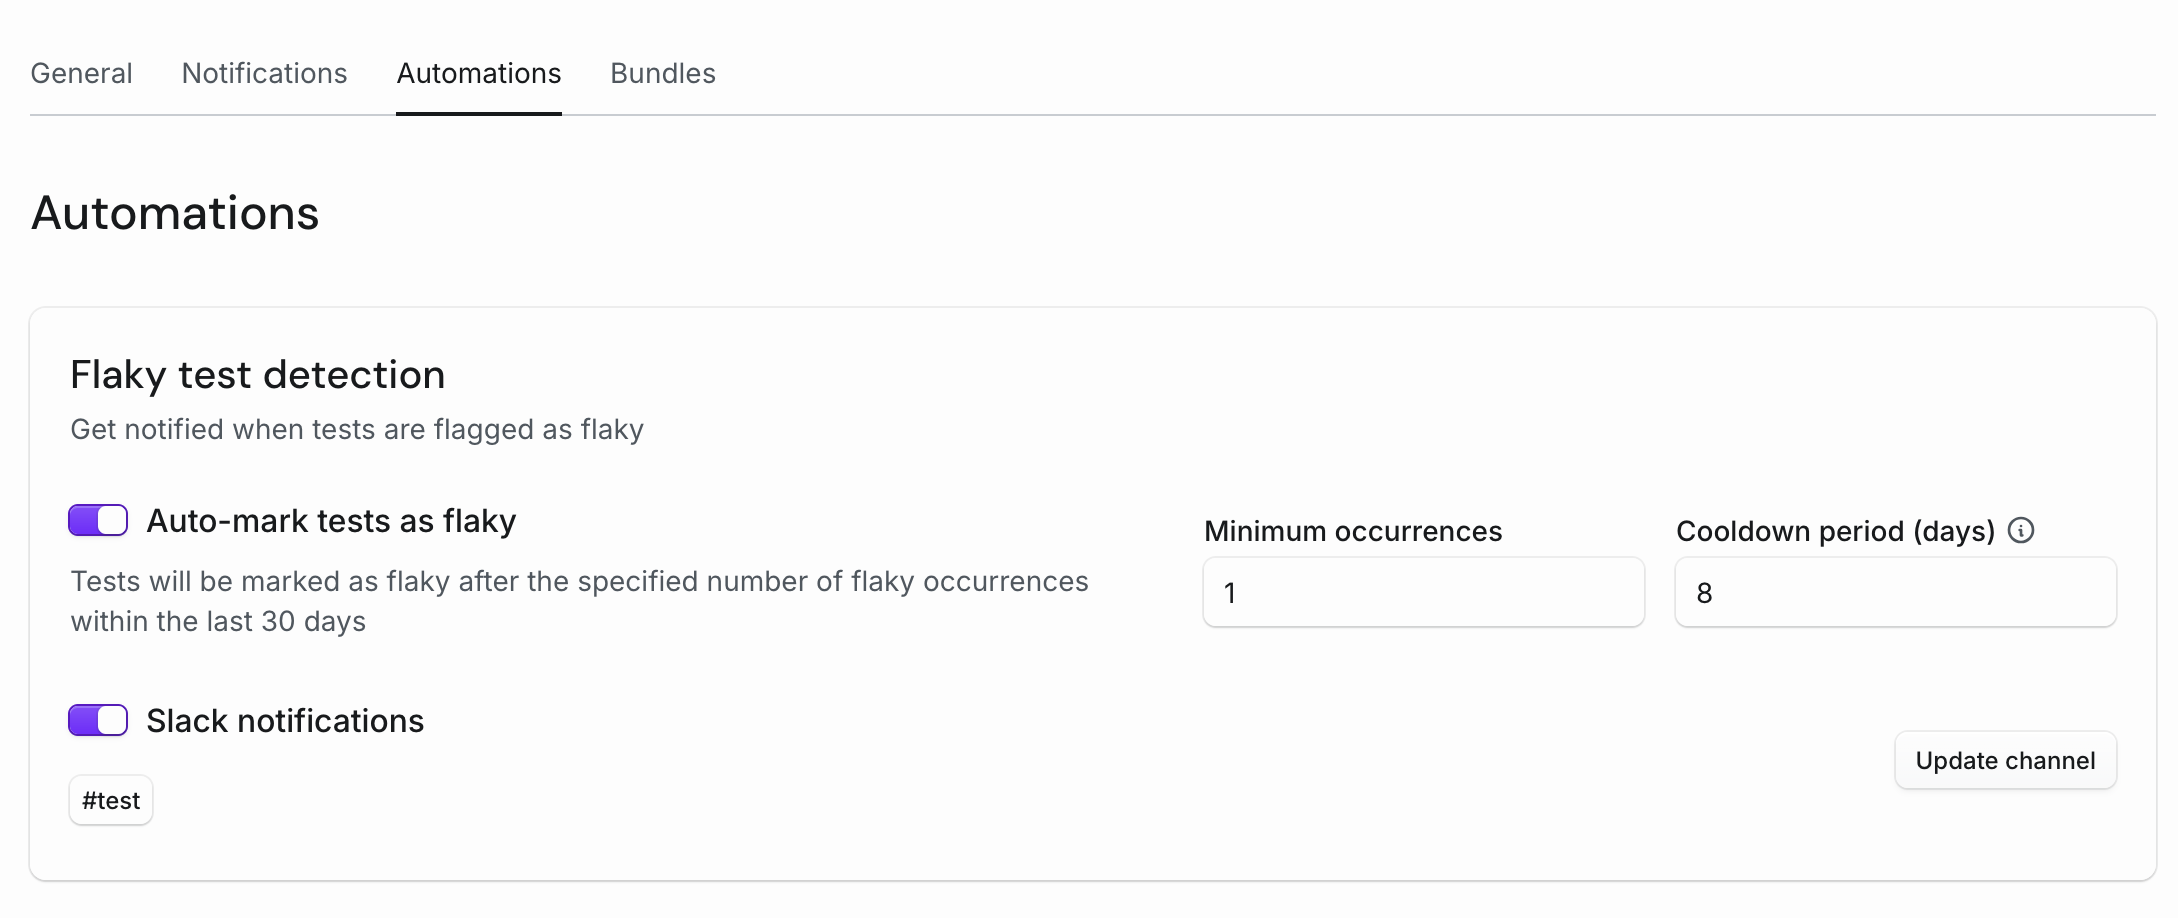
Get notified via Slack the moment a test becomes flaky. Configure alert rules to trigger when flaky runs exceed your threshold, and receive instant notifications with direct links to investigate the flaky test case.
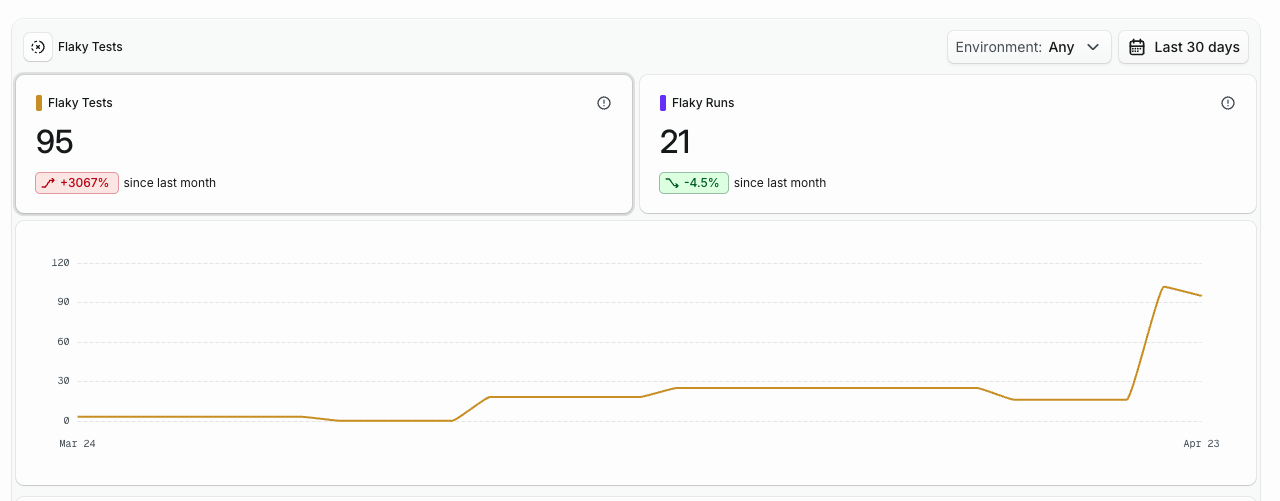
Identify and track flaky tests in your CI pipelines. Tuist automatically detects flaky tests when the same test produces different results on the same commit across CI runs, or when using Xcode's test retries. Browse all flaky tests in the new Flaky Tests page, see flakiness rates on individual test cases, and track flaky runs over time.
Catch slower builds, cache degradation, or test slowdowns as soon as possible, minimizing the impact to your team's productivity. Alert rules proactively notify you via Slack when key metrics significantly regress.
Stay on top of your project's build health with scheduled Slack reports. Get daily summaries delivered directly to your Slack channel with key metrics including build duration, test duration, cache hit rate, selective test effectiveness, and bundle size - all with trend indicators showing how your metrics compare to the previous period.
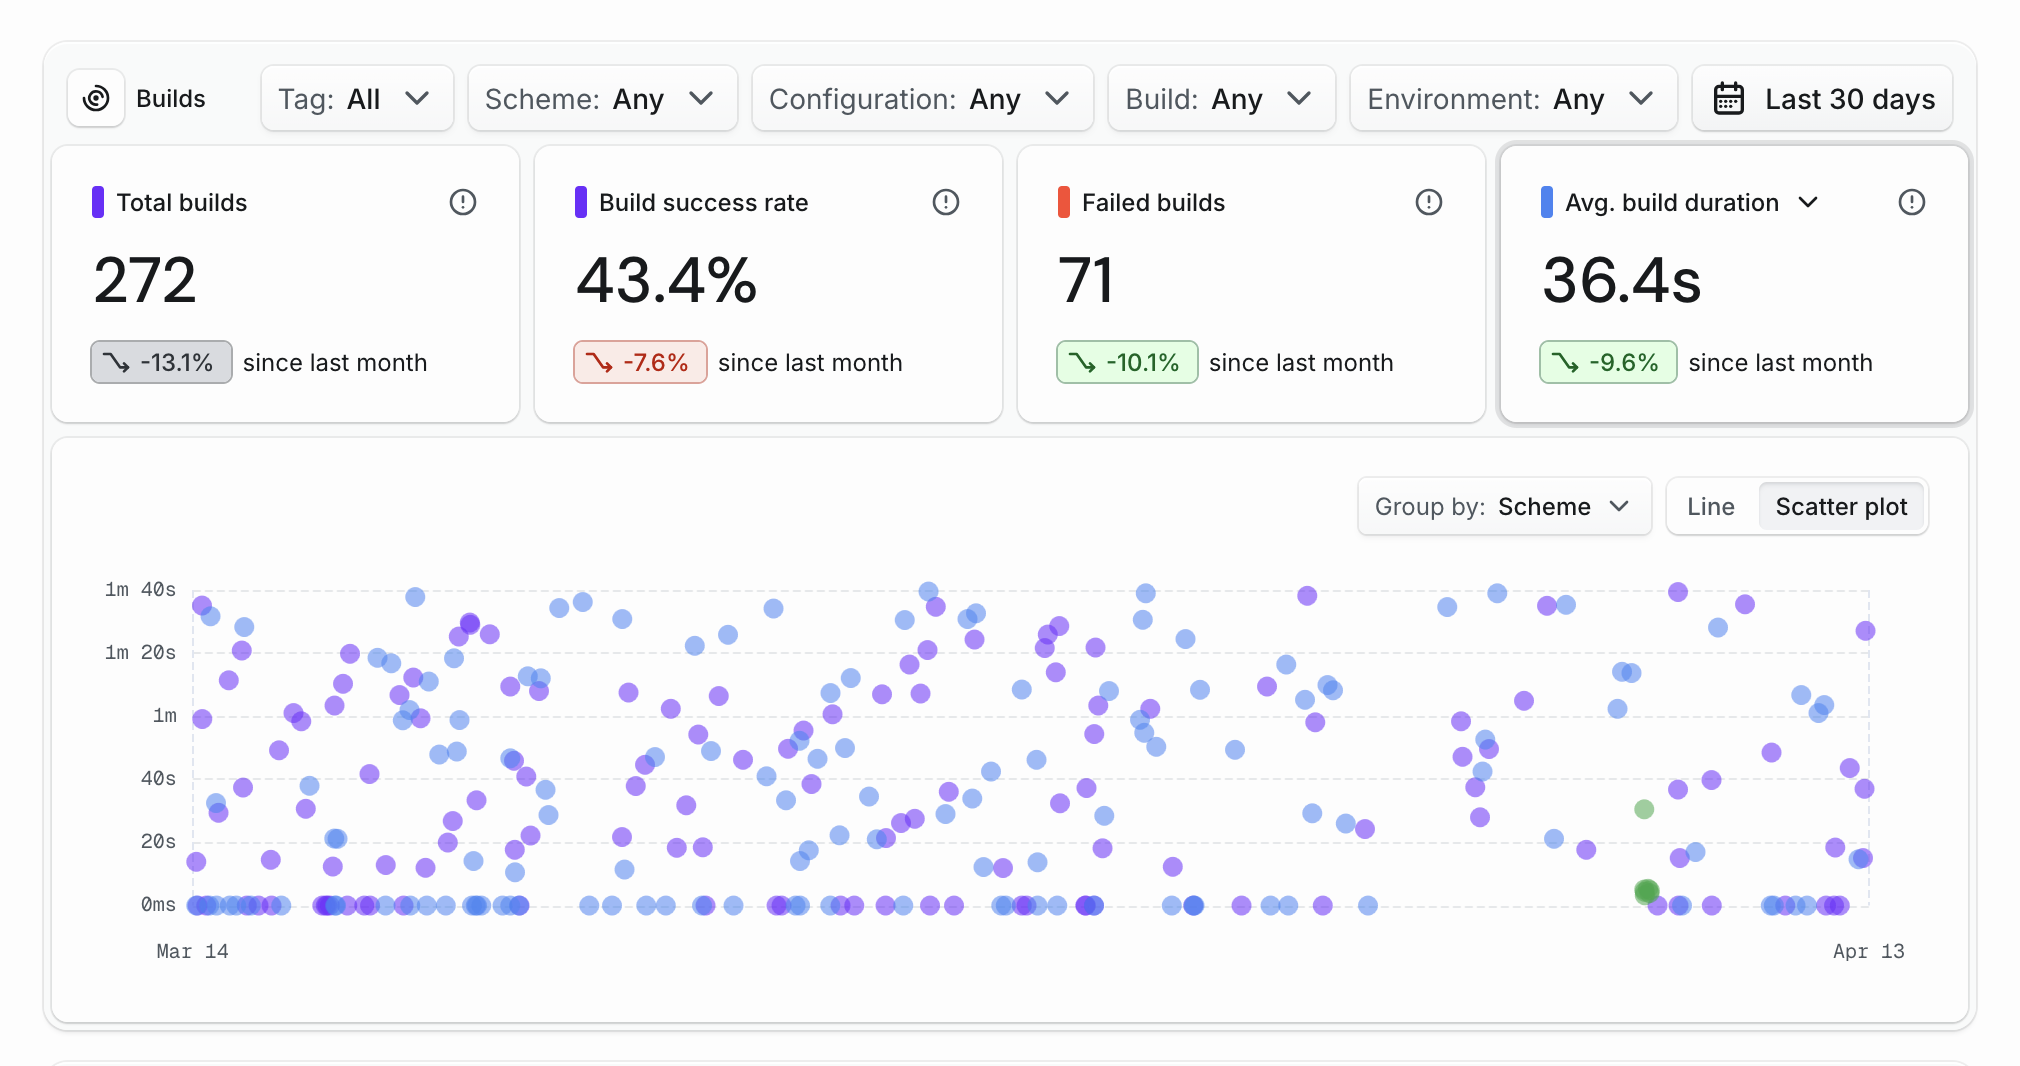
All analytical date ranges have been replaced with a date picker that lets you select the time range for your data instead of just last 7 days, last 30 days, or last 12 months. Choose from quick presets or define a custom date range using the calendar.