Tuist

Tuist

История изменений

Product

Tests

The dashboard now includes a new "Tests" page that shows a summary of your tests – such as your average test duration, recent test runs, or your slowest test cases.

Tests page

Product

Test Cases

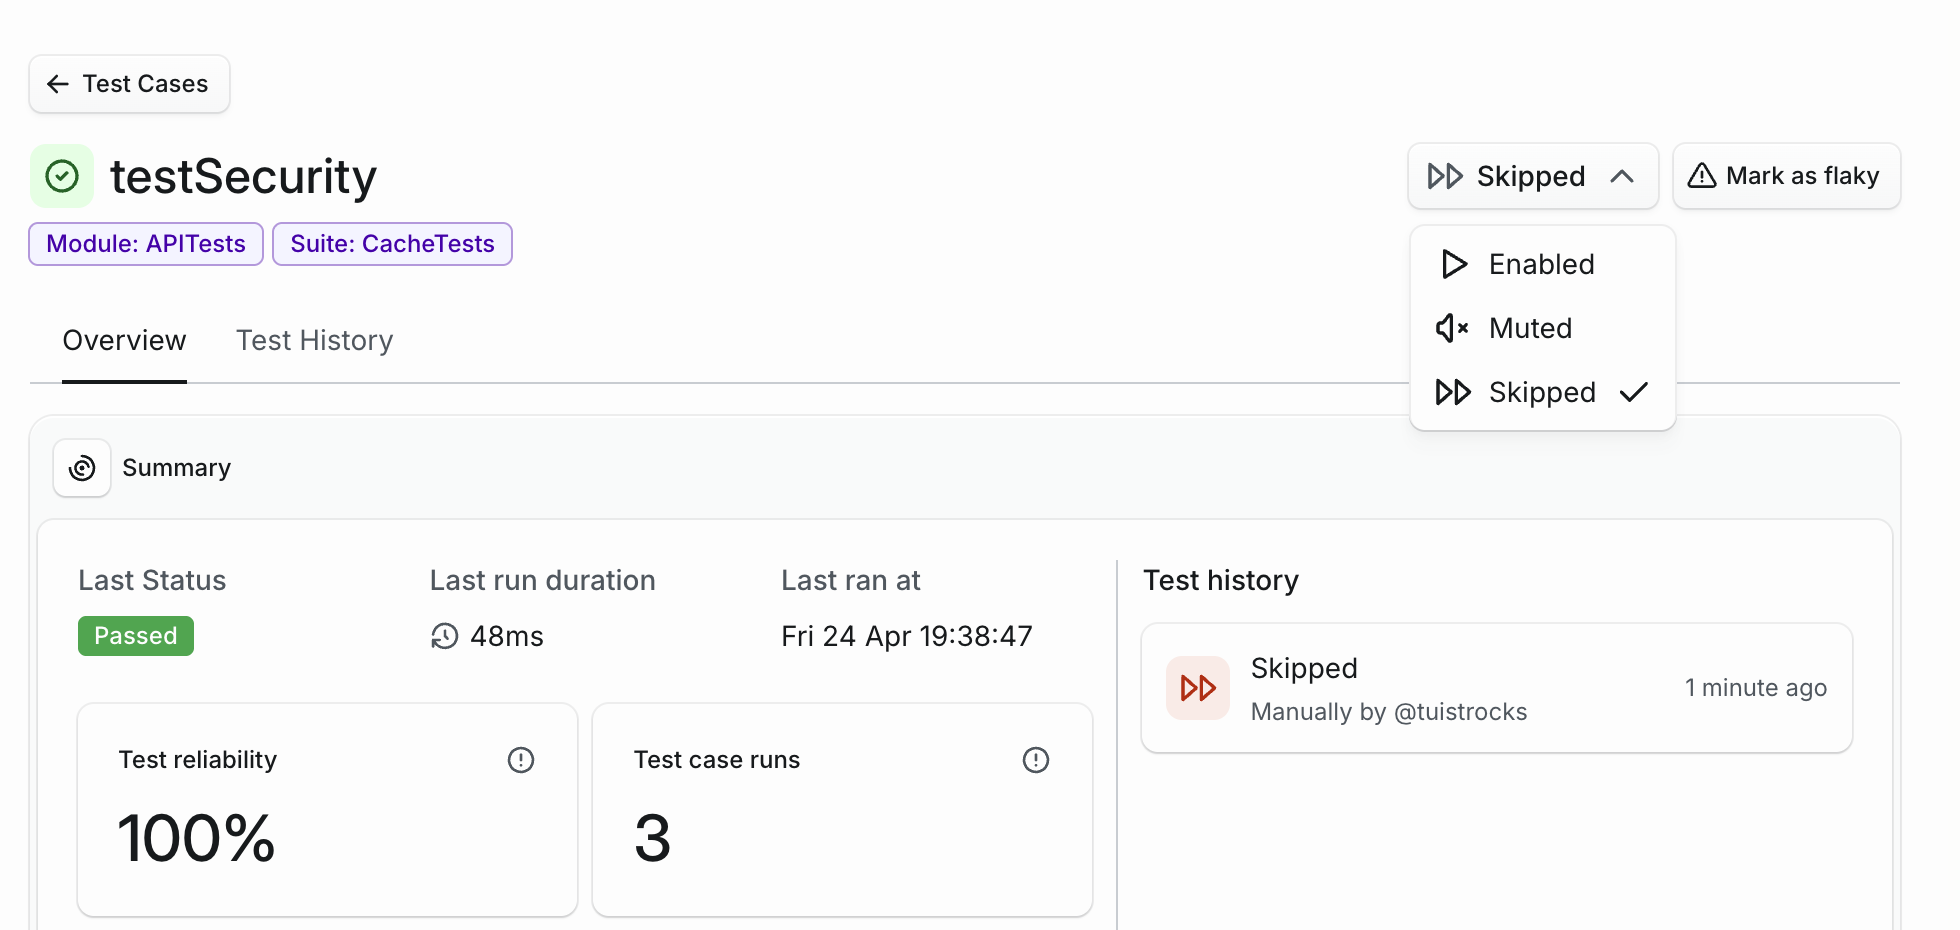
We're adding a new "Test Cases" page that shows a summary of your test cases, including your individual slowest test cases. Additionally, you can see a history of runs for each individual test case in the test case detail page.

Test Cases page Test Case page

Product

CI test run links

When viewing test details, we link to the corresponding CI run when the test was executed by a supported CI platform.

Test CI run button

Product

Test Insights

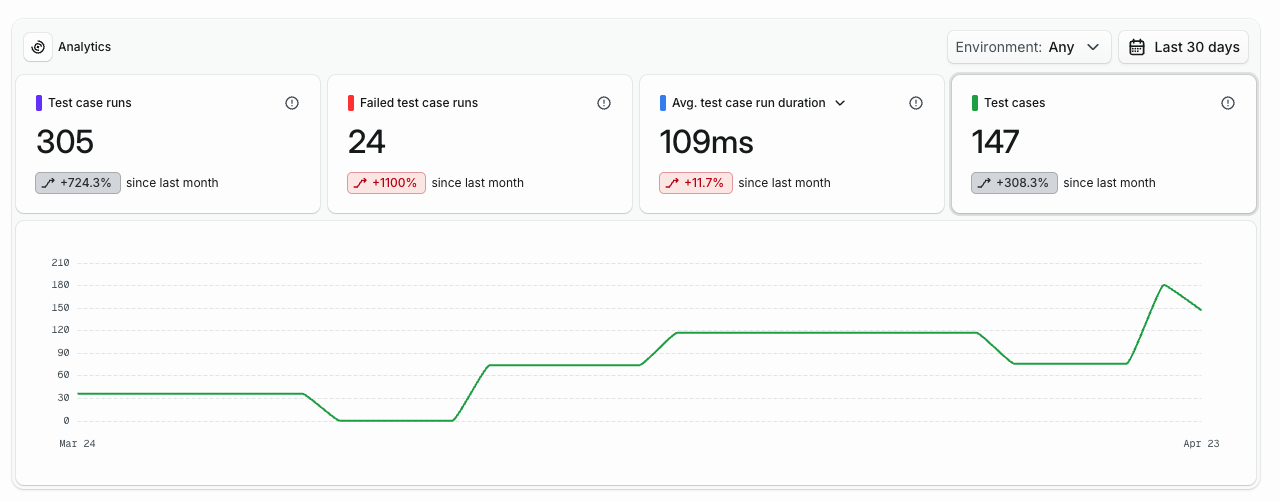
Track your test performance with the new Test Insights. Monitor test durations, identify slow tests, and quickly debug failed CI runs. See documentation to get started.

Test Insights dashboard

Product

Module Cache analytics overview

We added a new Module Cache page in the sidebar that gives you an overview of the module cache hit rate and the absolute number of hits and misses.

Xcode Cache overview

Product

Cache hit rate widget

The Compilation Optimizations tab now displays a cache hit rate widget, showing the percentage of modules successfully retrieved from the cache:

Cache hit rate widget showing 72.2% cache efficiency

Product

Binary cache filtering

The binary cache analytics now includes filtering by hit type, allowing you to quickly identify which modules were cached locally, remotely, or missed the cache entirely:

Binary cache filtering by hit type

Product

Xcode Cache analytics overview

We added a new Xcode Cache page in the sidebar that gives you an overview of the Xcode cache hit rate and your overall download/upload.

Xcode Cache overview