Copy logo as SVG
Copy wordmark as SVG
Download brand assets
Brand guidelines

Registro de cambios

Product

Apply automations to existing matches

Test automations can now act on tests that already meet your conditions. Select Apply to existing matches when creating or editing an automation, and see how many tests currently match before saving. By default, actions still run only for new matches.

We’ve also simplified the editor with collapsible condition, action, and recovery sections, each with a concise configuration summary.

Automation editor showing the option to apply actions to existing matches

Product

Inspect the inputs behind a target's cache hash

When two runs produce different hashes for the same target, the details should help explain what changed. Expand a target in Module Cache or Selective Testing to see its direct target dependencies by name, with links to each module's details. The combined Dependencies hash remains available, so you can spot changes even when the dependency names stay the same.

An expanded CheckoutFeature target showing its destinations, direct dependency links, individual input hashes, and combined dependencies hash

The destination list now reflects the platforms used to compute the hash. This matters when an external library supports several platforms but a particular project uses only some of them. Details also include embedded-product references, foreign-build inputs, and UI-test device and runtime inputs when reported by the CLI.

Copy as JSON includes the dependency names and individual hash inputs for comparing runs. Inputs that older CLI versions did not report remain unavailable.

Product

Move Bazel remote-cache traffic with less bandwidth

The Tuist cache now negotiates the zstd compressor on both ByteStream transfers and BatchUpdateBlobs/BatchReadBlobs, so cache uploads and downloads from Bazel move meaningfully fewer bytes over the network on typical action outputs.

Cache contents on disk are unchanged: compression is a wire-only concern, verified against the same content digest Bazel already sends, so cache accounting and deduplication behave exactly as before. Bazel opts into wire compression via --remote_cache_compression=true, and tuist bazel setup now writes that flag into the generated .bazelrc.tuist — so re-running setup, or picking up the credential helper's next update pass, is enough for existing projects to start using it. Older clients keep working with uncompressed transfers.

Product

Explore Gradle and Bazel build timelines

The Timeline tab is now available on Gradle and Bazel build reports, bringing the same interactive view of build execution as Xcode. See what ran in parallel, zoom into a slow interval, and line up individual steps with machine usage to understand where build time goes.

For Gradle, tasks, configuration, and artifact transforms appear alongside synchronized CPU, memory, network, and disk charts. Filter by categories such as compilation, testing, or packaging, then select a step to inspect its timing and recorded outcome. Machine metrics now live in the Timeline tab, so you can explore them together with the work that was running.

A real Tuist Android build showing Gradle tasks and configuration alongside CPU, memory, network, and disk usage

For Bazel, the timeline uses the recorded trace profile to show work across analysis, fetching, compilation, linking, and other build phases. CPU, memory, and network charts share the same time range. Published action results add outcomes and available compiler diagnostics to individual steps, helping you investigate failures without leaving the build report.

A real Kura Bazel build showing 34,103 recorded steps, CPU utilization as a percentage, memory, and network usage

Search by step, target, or category, and use the legend to focus on a particular kind of work. The recorded steps are also available through the API and MCP tools for investigating builds from your editor or automation.

Update the Tuist Gradle plugin to include startup-aligned recordings in new reports. For Bazel, run tuist bazel setup in your build environment to enable trace uploads and record CPU capacity. Existing builds keep the data they already recorded; readings that were never collected cannot be recovered.

Product

Get an email before reaching your Air limits

Air now emails all organization admins and personal account owners at 80% and 100% of their monthly cache or runner allowance. Each email shows current usage, the reset date, and a link to upgrade to Pro, helping you avoid interruptions.

Air usage warning email showing 160 of 200 remote cache hits used and a link to review usage and upgrade

Product

Reuse unchanged chunks when sharing Xcode build outputs

Small source edits can produce large compilation outputs. Tuist's Xcode cache now uses content-defined chunking with compatible cache servers to avoid transferring unchanged parts of those outputs.

Uploads send only chunks the server is missing. Downloads reuse verified chunks retained on your machine, fetch the missing pieces, and reconstruct the exact original output. The bounded local chunk cache survives cleaning DerivedData and restarting the cache service. Existing clients and unsupported servers continue to use ordinary whole-output transfers.

In local generated-fixture benchmarks, changing one C function reduced its object's transfer payload by 47.4%, and renaming one property in a large Swift module reduced its payload by 27.8%. These measure transferred bytes, not build-time improvements; savings depend on the output, the edit, and which chunks remain cached. Compiler invalidation is unchanged.

See the Xcode cache guide for how chunk reuse works and how to configure existing and Tuist-generated projects.

Product

Find the Gradle tasks slowing down your builds

A slow build tells you where to start looking. The new Tasks page shows which Gradle tasks take the most time across builds, how often they execute, and how often they hit the cache.

Sort tasks by cumulative time to find repeated work that adds up, or compare p50, p90, and p99 durations to spot tasks with slow outliers. Filter by branch or environment to focus on the builds you want to improve.

Gradle task analytics in the Tuist dashboard, showing execution trends, cache hits, duration percentiles, and tasks ranked by cumulative time

Select a widget to explore execution trends, cache hit rates, or average and percentile durations over time. Open a task to inspect its individual executions, including outcomes and durations, then inspect an execution’s cache behavior and timing. Execution details link to the build behind them and back to the task overview.

Find it under Builds > Tasks in your Gradle project.

Product

Store large build artifacts more efficiently

Large build outputs often change only in a few places, but traditional remote caches store every new version as a completely separate object. Kura now supports Bazel's content-defined remote cache chunking. The client splits a large output at stable content boundaries, uploads only chunks the cache does not already have, and records a compact recipe that reconstructs the original bytes.

This can reduce storage growth and upload work for successive versions of large artifacts while preserving the same verified content digest. Kura reconstructs downloads as a bounded stream, verifies every new recipe before accepting it, and safely falls back to a cache miss when a node cannot read the recipe. The capability is enabled by default for Bazel clients that negotiate it, while operators can temporarily disable new recipe writes during a reader-first fleet upgrade.

Product

Run Buildkite jobs on Tuist Runners

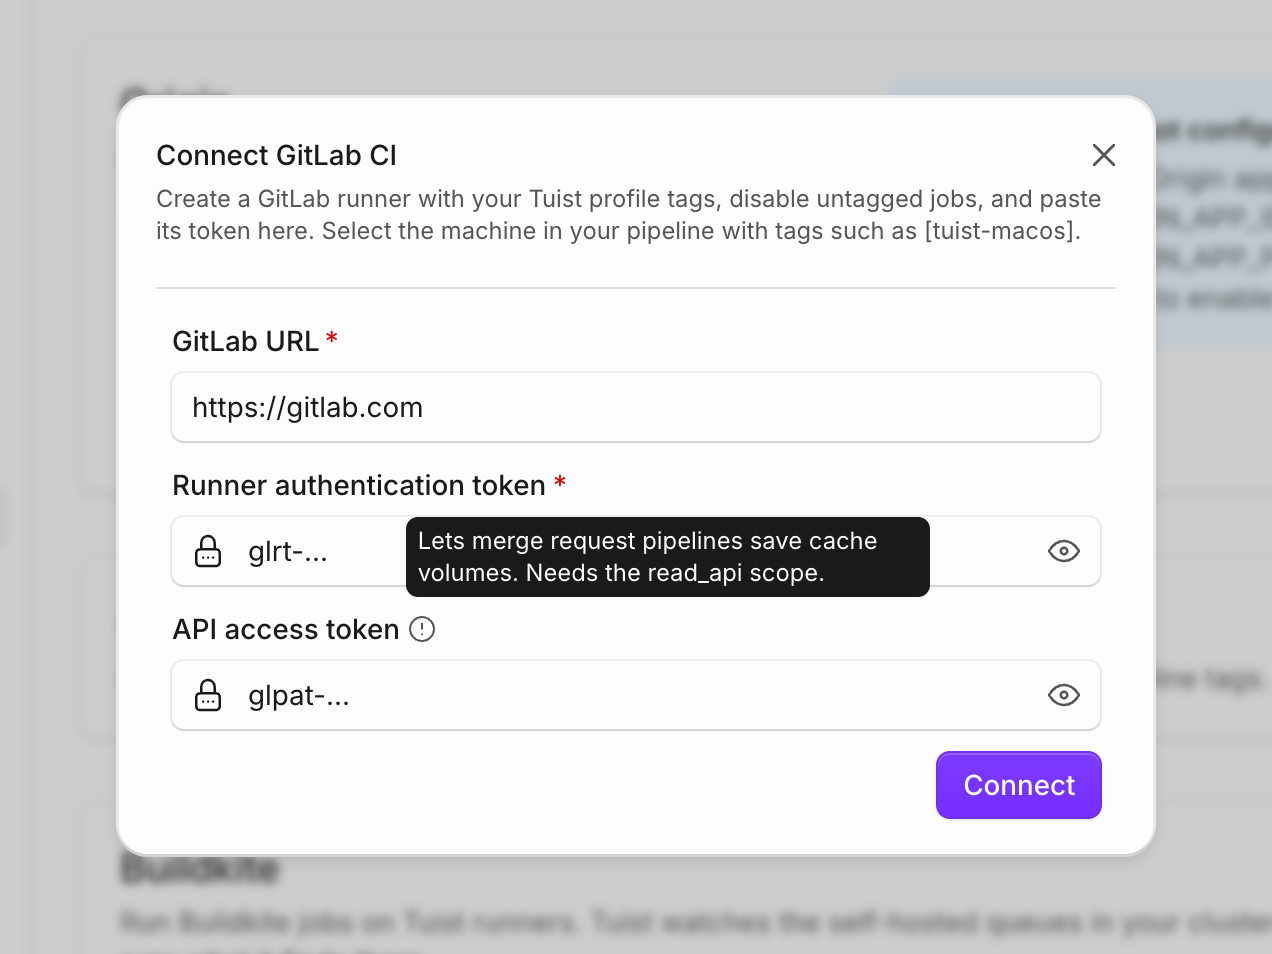
Tuist Runners now take jobs from Buildkite. Connect a cluster under Settings › Integrations with a cluster agent token, create a self-hosted queue named after a runner profile such as tuist-macos, and target it from a step with agents: { queue: tuist-macos }.

The Buildkite card in Tuist settings, showing a connected organization and its cluster agent token

Jobs run on the same macOS and Linux fleet as GitHub Actions jobs and show up under Runners with their logs and duration. The guide walks through the setup.

Product

Understand Bazel builds and cache behavior

Bazel projects now show completed builds and tests alongside the build systems already supported by Tuist. Each invocation includes its command, targets, result, duration, processor time, action counts, package counts, and metadata reported by Bazel.

The new cache view connects action-cache and content-cache requests to the invocation that produced them. It shows hit rates, transfer volume, latency, throughput, action names, target labels, and individual request outcomes.

Existing Bazel projects receive these views automatically after configuring Tuist as their build event and remote cache service.