Tuist

Tuist

変更履歴

Product

A failed test run doesn't always mean a test failed. Sometimes a target's .xctest bundle won't load, or the app under test never launches, so the tests never get to run at all. Xcode treats these as errors rather than test failures, and now Tuist does too: run and target-level errors show up in a dedicated Errors section on the test run page, each with the target that hit it and the underlying message.

The Errors card on a test run page, listing a run-level error where the app couldn't be launched and two targets, IntegrationTests and UITests, whose test bundles failed to load, each shown with its error message

Pulling these out of your test cases keeps your counts honest, an error is no longer miscounted as a failed test, and makes the two kinds of problem easy to tell apart. We also renamed the failures section to Test Failures, so each reads as what it is: Errors stopped your tests from running, Test Failures are the assertions that didn't hold.

Product

Your module cache hit rate tells you how many modules you skipped rebuilding. It never told you how much data that cache actually moved, or how quickly. Now it does.

The Module Cache tab of a tuist generate run: Downloaded and Uploaded totals alongside cache hits, misses, and hit rate, with Download and Upload throughput below the cacheable targets breakdown

Every run's Module Cache tab surfaces the network side of your cache. Alongside cache hits, misses, and hit rate, you'll now see:

  • Downloaded and Uploaded: the total size of prebuilt modules the run pulled from and pushed to the remote cache.
  • Download throughput and Upload throughput: how fast those transfers actually moved, as a time-weighted average.
Product

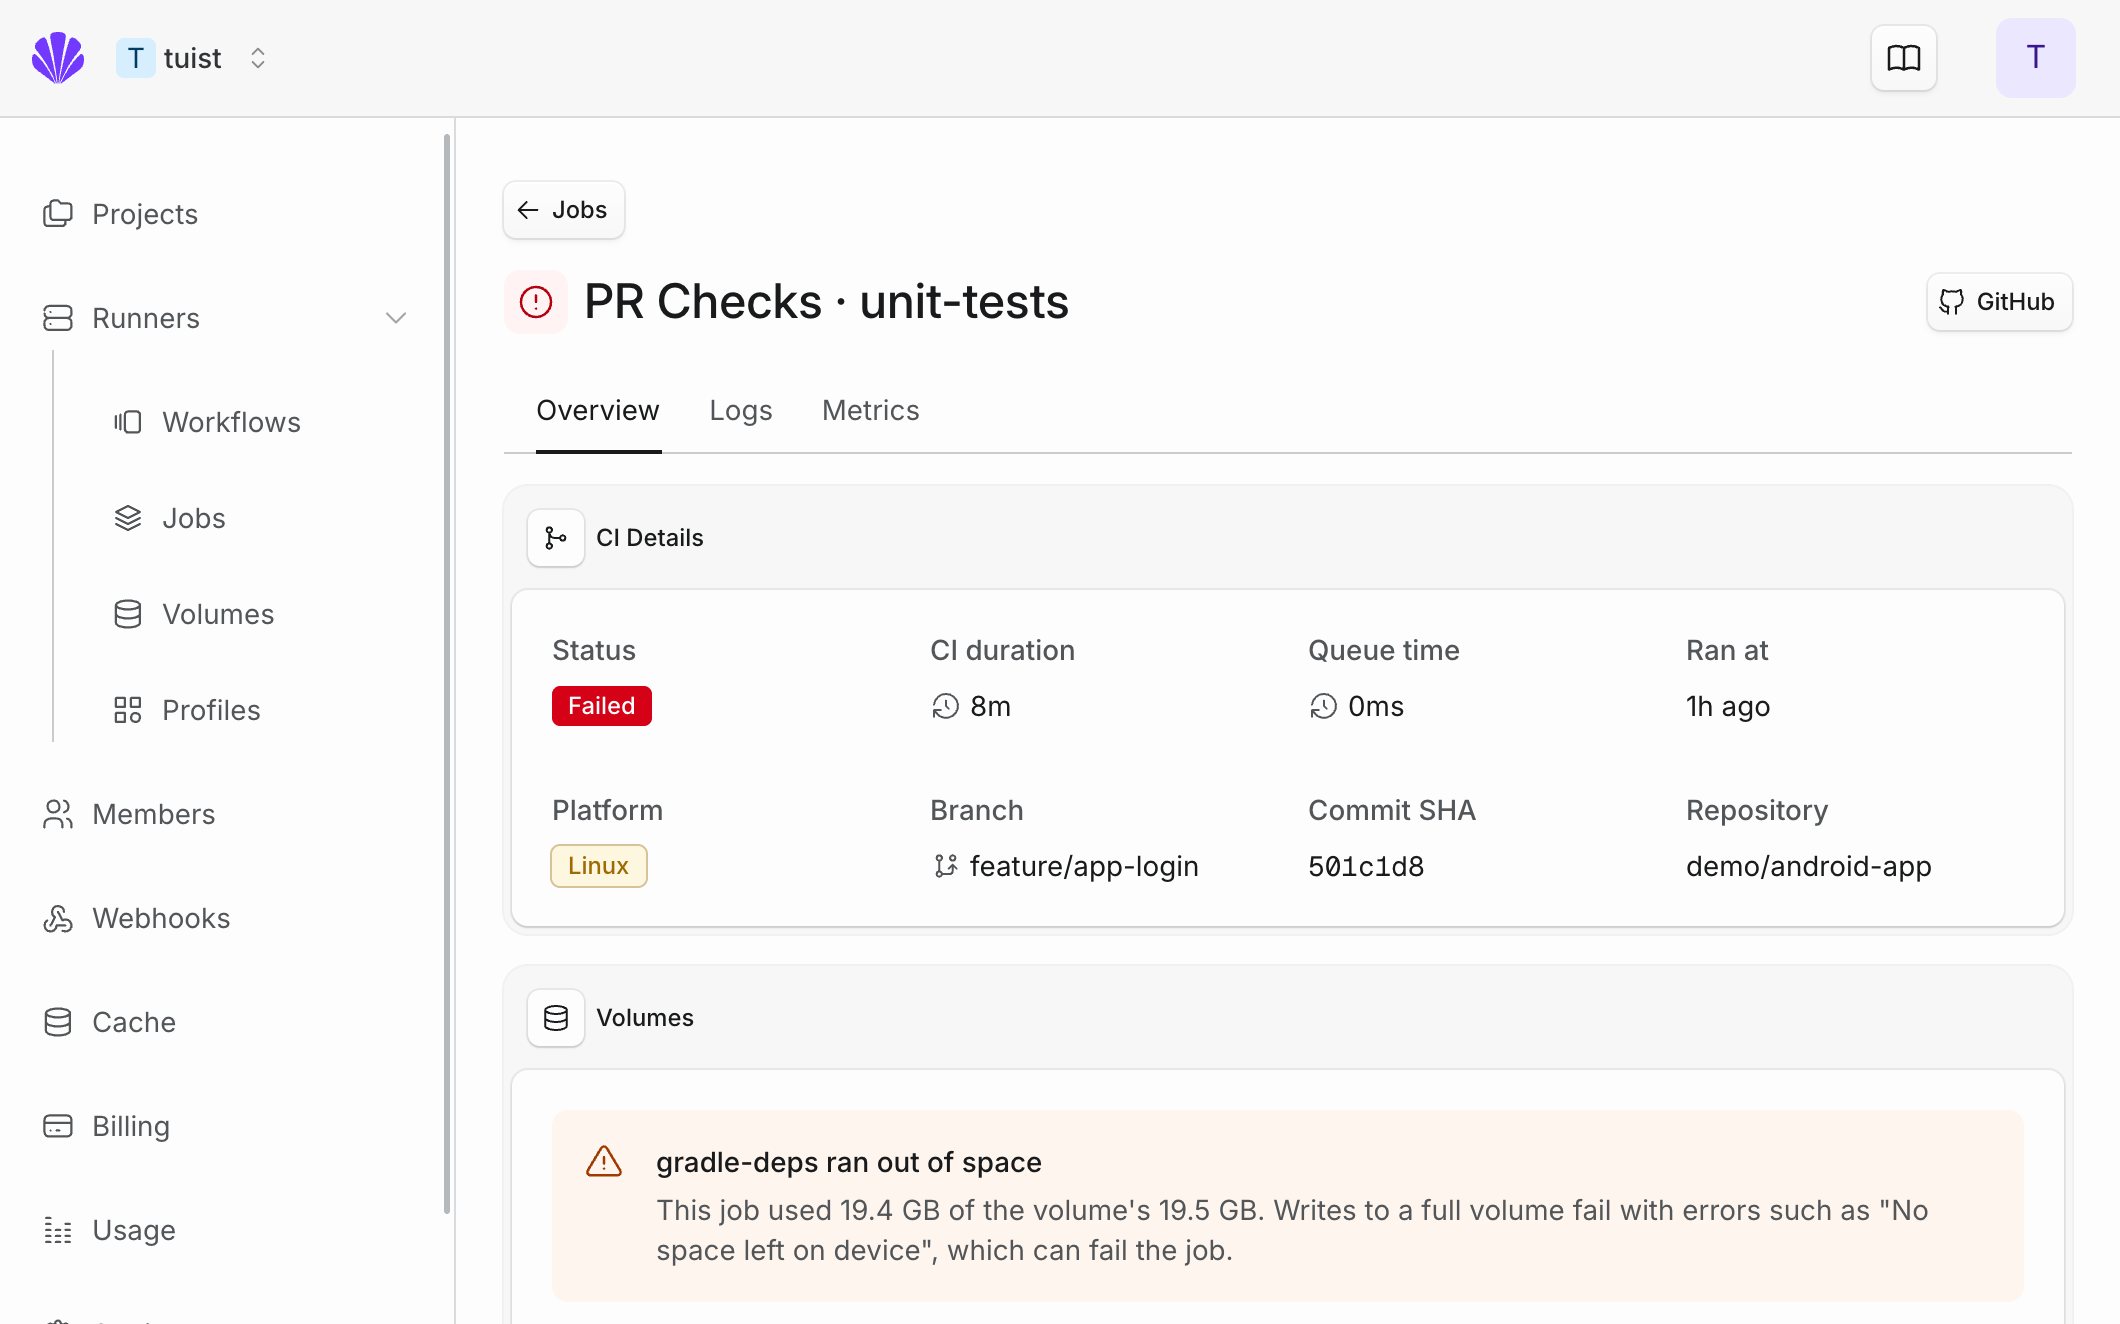
Every job that runs on Tuist Runners now records how hard its machine worked. CPU, memory, network, CPU I/O wait, and storage are captured for the full duration of the run and plotted on the job page, so you can stop guessing whether a build is CPU-bound, starved for memory, or filling up the disk.

A runner job's CI Details card with CPU, Memory, and Network charts below the job metadata, each plotting usage across the full run

Use it to right-size your runner profiles: move a job that barely touches the CPU onto a smaller machine, or give a job pinned at 100% more cores so it ships faster. Hover a step and the charts highlight that window, so you can tell which step pinned the CPU or filled the disk.

Product

Tuist uses your project's default branch as the baseline for analytics, insights, and comparisons, from bundle size checks to test reliability and flaky test detection. It was already configurable through the CLI, and now you can view and change it directly from your project's settings too. When you connect a GitHub repository, Tuist also adopts the repository's default branch automatically.

The Default branch card in a project's General settings, showing the current branch as a "main" badge with an edit button

Product

Module Cache can now cache framework targets that support your tests, even when they link XCTest or Swift Testing. This helps projects with shared assertion helpers, fixtures, or test utilities reuse binary cache artifacts instead of rebuilding those helper modules from source every time.

Test bundles themselves are still left out of the binary cache. The change only applies to regular framework products that tests depend on, so your test targets keep their normal behavior while their reusable support modules can benefit from local and remote cache hits.

Product

Module Cache can now cache static and dynamic library targets, not only framework targets. Library products are warmed, stored, and consumed as XCFramework artifacts, including Swift modules and public headers, so projects with mixed framework and library graphs can reuse binary cache artifacts across local and CI builds.

Test bundles remain excluded from the binary cache, but reusable library targets that support tests can now benefit from the same cache flow as test-support frameworks.

Product

Build and test times are coming to Grafana. The new Tuist data source plugin pulls the same p50, p90, p99, and average durations you see in your Tuist dashboard and renders them as native Grafana time series, so build and test performance can sit next to the rest of your observability. You configure it with a Tuist account token, then pick a project and an environment (CI or local) and the percentiles you want to chart. Project and environment are dashboard variables, so a single dashboard works across every project the token can reach, and you can watch how your pipelines trend as you optimize them.

The plugin is not published to the Grafana catalog yet. We are getting it ready for release and will update this entry once it is available.

A Grafana dashboard with Project and Environment dropdowns showing Tuist build and test duration percentiles over the last 30 days

Product

Some tests are not intermittently flaky; they are broken, or failing so often that they drown out useful signal. Automations can now monitor Test reliability across branches and trigger when it drops below your chosen threshold. Pair it with actions like changing the test's quarantine state, marking it as flaky, or notifying Slack, so broken or consistently failing tests can be handled automatically.

The Create automation modal configured to mark tests as flaky when their test reliability is less than 90% over the last 30 days

Product

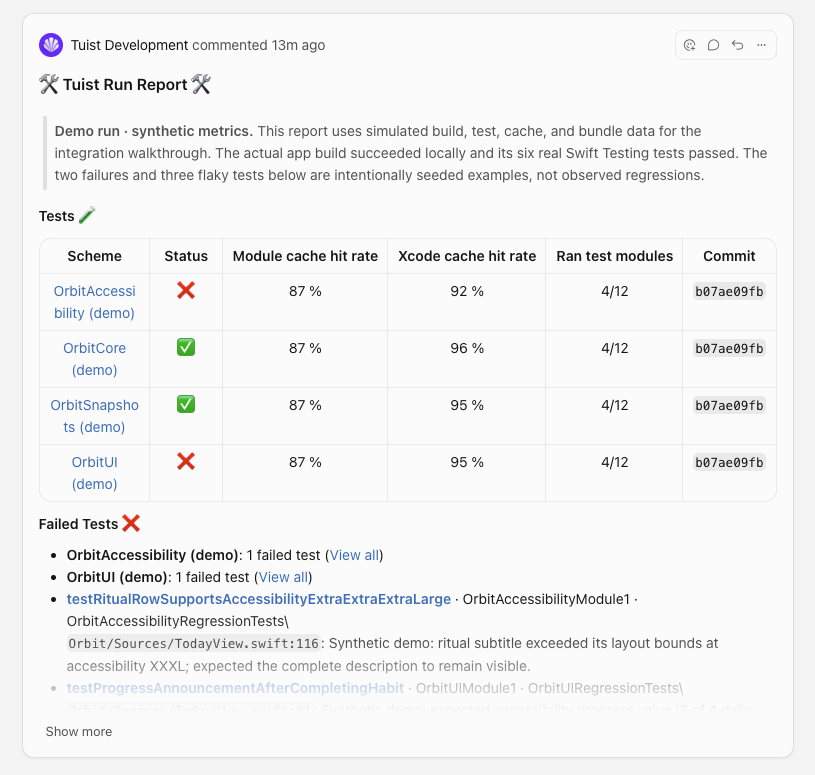
When Tuist runs in GitHub Actions, it now writes a Tuist Run Report to the Actions job summary. The test and build results for the run show up right on the workflow run page, with a link to the full report on Tuist, and nothing extra to set up.

This is especially useful with merge queues. A merge queue run is not attached to a pull request, so there is no comment to post, and until now you had to wire up your own JUnit reporting to see results. The summary now shows up for every authenticated run, whether it came from a pull request or a queue.

A GitHub Actions run summary showing the Tuist Run Report with a table of build results per scheme

Product

Tuist can now use prebuilt libraries from Swift Package Manager dependencies when generating projects. This is especially useful for macro-heavy packages such as SwiftSyntax, where support libraries are large and expensive to build from source.

When a package provides prebuilt metadata, Tuist wires the generated project to the prebuilt library search paths, include paths, and linker flags instead of generating the corresponding source targets. Projects that depend on Swift macros can keep the same package workflow while avoiding unnecessary SwiftSyntax support builds in the generated Xcode project.

There is nothing new to configure for packages that expose the prebuilt metadata. Run tuist install and tuist generate as usual, and Tuist will use the available SwiftPM prebuilts during graph loading and project generation.