ビルドインサイト
ビルドの健全性を追跡。
ビルドの健全性を追跡。
パフォーマンストレンドを監視。
ローカルとCIの環境でビルドパフォーマンスを監視し、ボトルネックになる前に遅延を検知します。
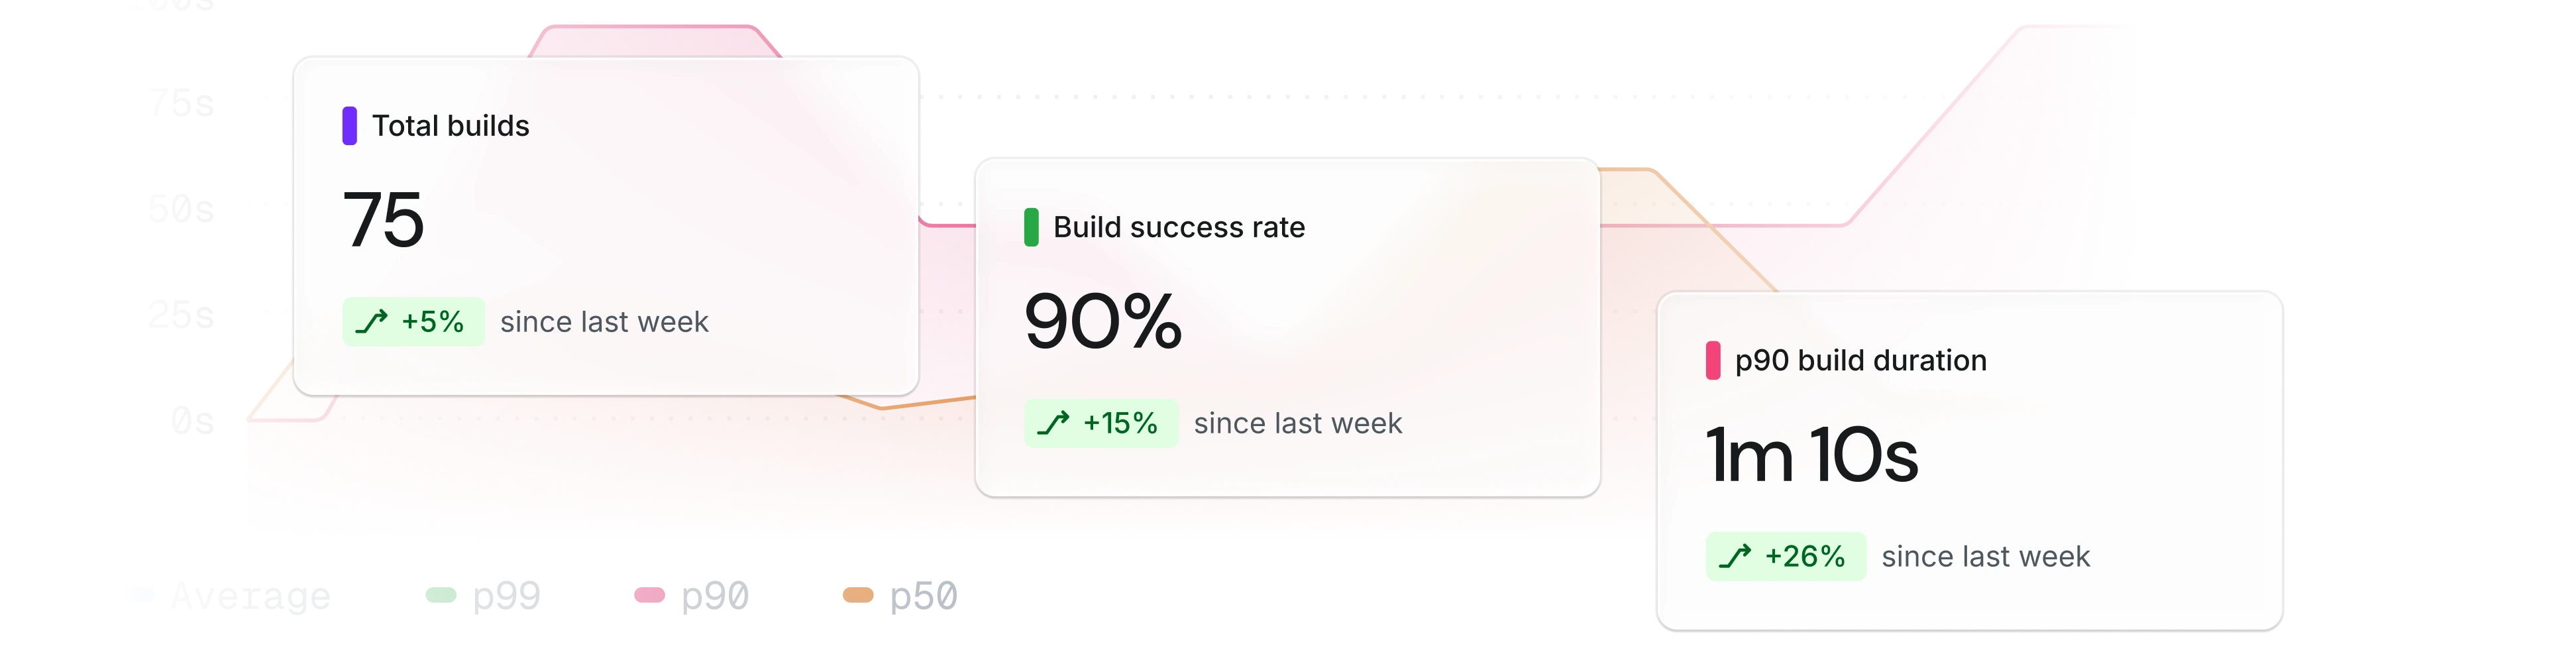
詳細なビルド時間追跡
ローカルおよびCI環境のモジュールおよびファイルレベルでのビルド時間を追跡。
CIとローカル環境の可視化
CIログを読むことなく、開発者マシンとCIランナー全体で統一された指標を提供します。
マルチチャネルアクセス
ダッシュボード、レポート、CLI、API、MCPサーバーを通じてインサイトを受け取ります。
過去24時間で分析されたビルド数
0
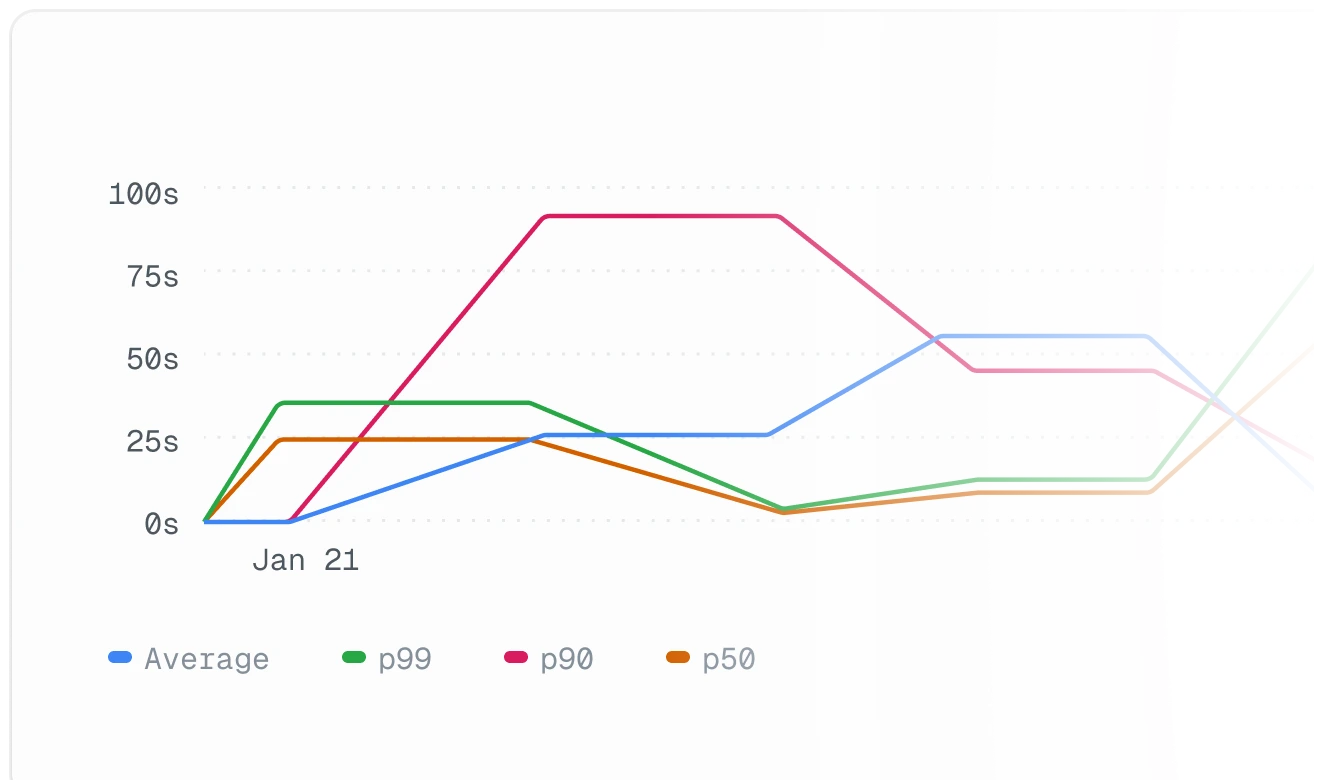
遅延が雪だるま式に増える前にキャッチ
時間経過によるビルド時間を追跡し、変更が大幅な後退を引き起こした瞬間を特定。
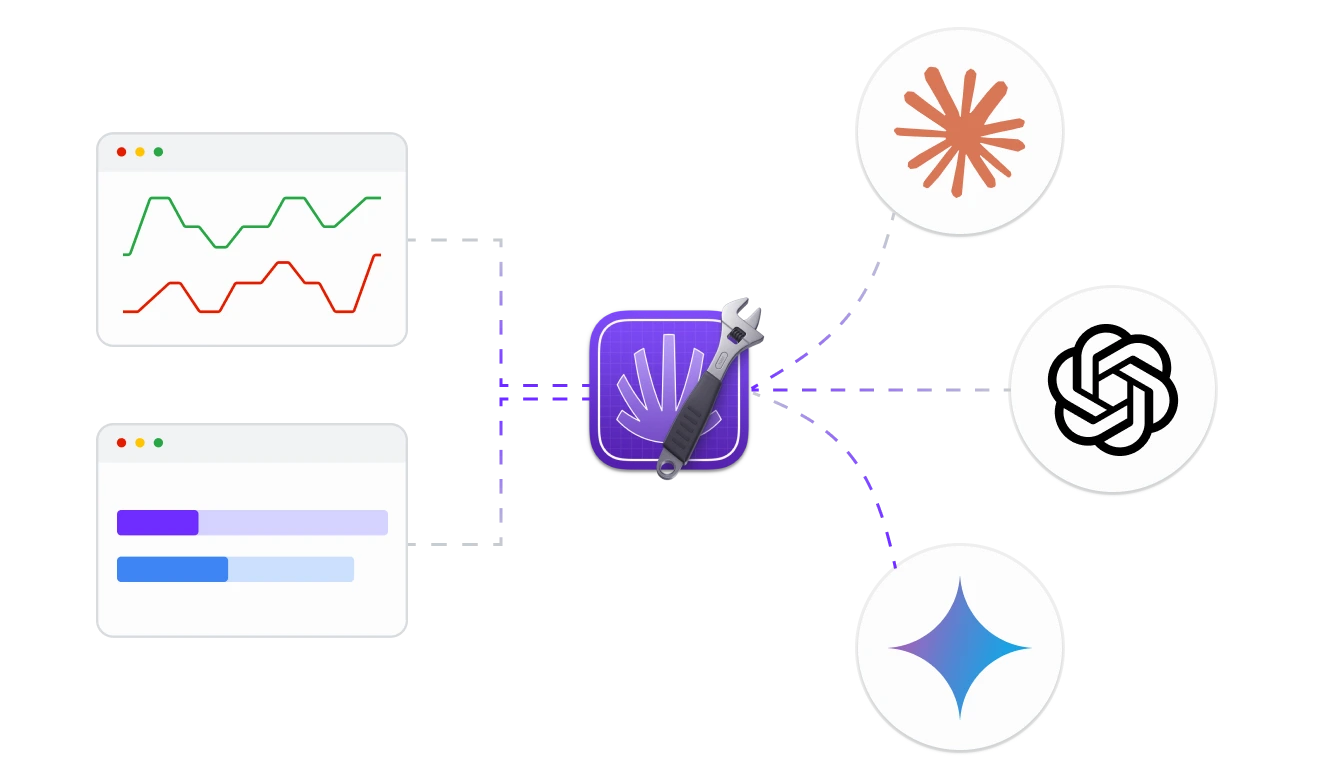
AIにボトルネックを特定させましょう
TuistのMCPサーバーとAPIは依存グラフとビルドデータをAIコーディングエージェントに公開します
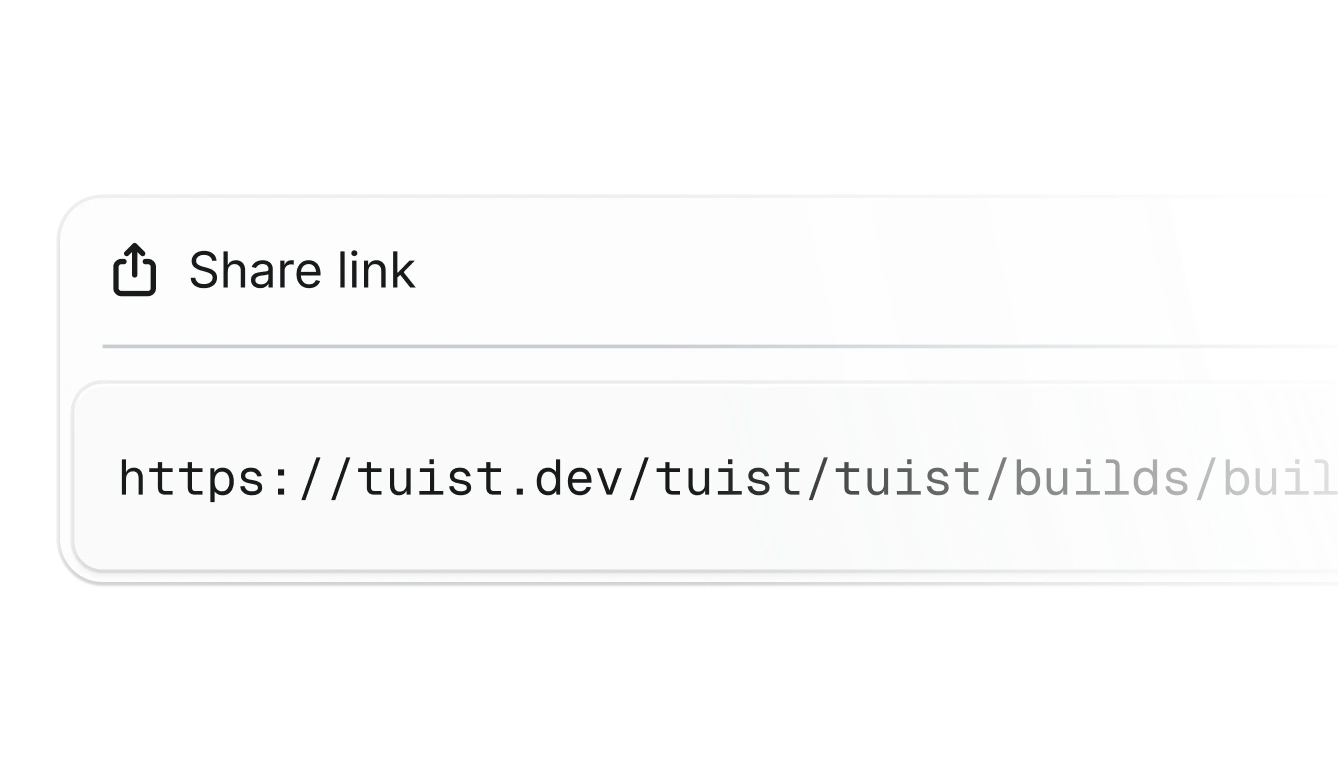
指標は簡単にアクセス・共有可能
ビルドインサイトはチームと共有できる単一のURLで利用可能です。
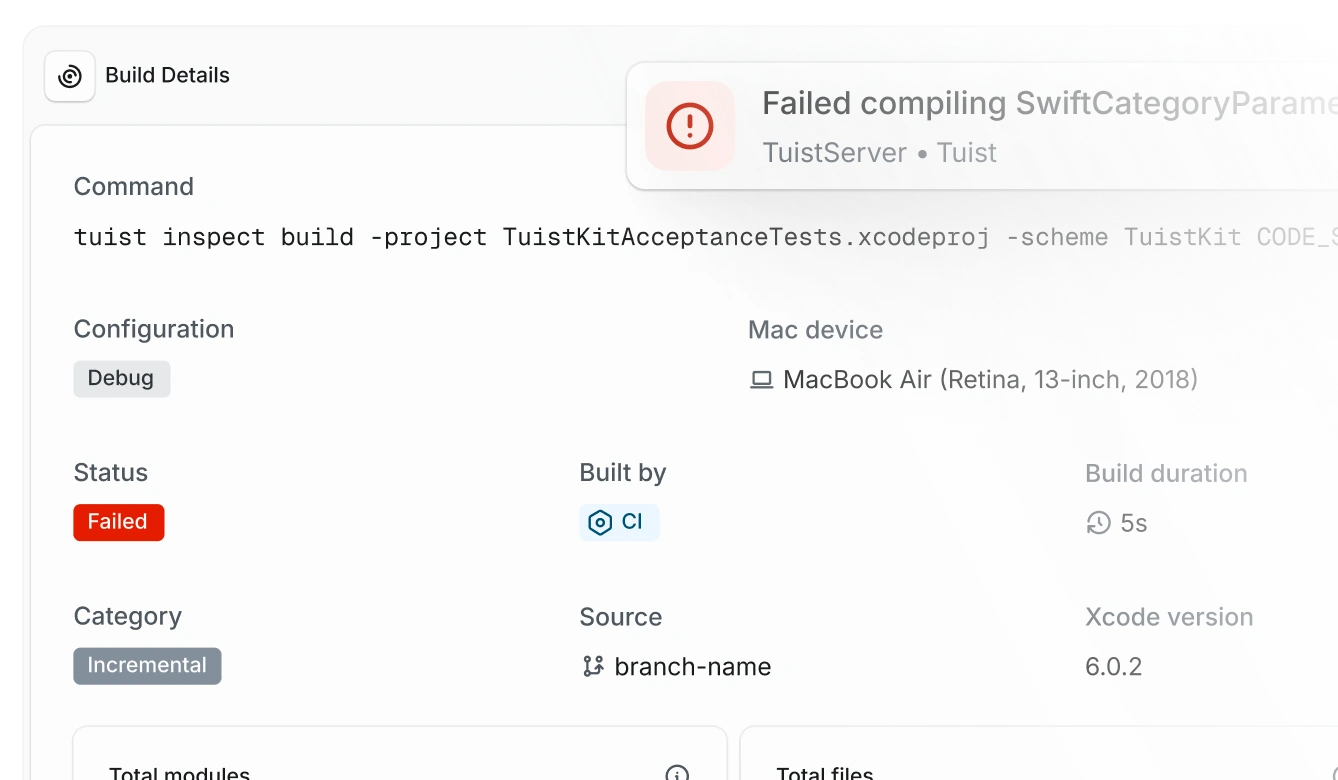
ビルドに影響を与える要因を理解
各ビルドには環境メタデータが含まれており、異なる設定がパフォーマンスにどう影響するか確認できます。