We've spent years helping teams scale their Xcode projects. Be it build caching, test insights, flaky test detection, or bundle analysis, we've built these features because we've seen firsthand how much time teams waste in slow builds, unreliable tests, and tooling gaps that no one has time to fill.
Along the way, we noticed something. Many of the problems we were solving weren't unique to Xcode. Slow builds? Gradle has them too. Flaky tests blocking PRs? That's universal. Build cache infrastructure that's expensive and painful to maintain? Teams working with Gradle deal with this every day. The underlying challenges are remarkably similar across ecosystems.
That's why we're excited to announce that Tuist now supports Gradle.
What's included
Build insights
Build time directly affects your feedback loop. As projects grow, build performance degrades. But most teams have no visibility into how or why. They track CI pipeline duration but can't answer basic questions: Which tasks take the longest? How does build time change across Gradle versions? Did that dependency upgrade actually make things worse? You can't improve what you can't measure. And with coding agents generating more changes than ever, slow builds don't just slow down one developer, they become a multiplier on wasted CI time across the whole team.
The plugin automatically sends build analytics to Tuist, giving you visibility into task execution and cache behavior in the dashboard. You can track which tasks take the longest or how build performance evolves over time. No additional configuration is needed, build insights are collected automatically once the plugin is installed.
Remote Gradle cache
Once you understand where build time goes, caching is the most effective lever to reduce it. Tuist provides a remote cache that integrates directly with Gradle's built-in build cache to share build artifacts remotely. When a task's outputs are already cached, Gradle skips execution and pulls the result from Tuist's remote cache. Your team stops rebuilding the same things over and over, and CI times drop.
But a remote cache is only as fast as the network between your builds and the storage. That's why Tuist hosts cache infrastructure with global coverage, giving you low latency no matter where your CI runners or developers are located. You get the speed of a local cache with the reach of a shared one, without provisioning or maintaining anything yourself.
On top of that, you get full visibility into how the cache is performing, such as hit rate over time or individual cache keys for each Gradle task, so you can understand exactly what's being cached and why something missed.

Test insights
A healthy test suite is a fast and reliable one. But as test suites grow, that's hard to maintain without data. Which tests are the slowest? Are they getting slower over time? Where should you focus your effort to get the biggest improvement? Without answers to these questions, test suite health degrades gradually until everyone just accepts that "tests are slow."
Tuist gives you the answers you need as the plugin automatically tracks every test run, individual test durations, failure patterns, and reliability trends. You can spot the slowest tests, catch regressions early, and focus your effort where it matters most.
Flaky test detection and quarantine
You change one line of code, push, wait for CI, and it fails on a completely unrelated test. You retry. Someone else merges in the meantime, so now you have conflicts. By the time you're green and merged, an hour and a half has passed — for a one-line change. Every retry is a context switch, every false failure is a distraction from real work, and most teams have no idea how much time they're losing. Worse, developers stop trusting the test suite. "It's probably just that flaky test" becomes the default assumption, and real bugs slip through.
With coding agents producing more PRs than ever, this problem scales with your team. If your test suite is flaky, your PR throughput doesn't scale and it ends being the bottleneck.
Tuist detects flaky tests in two ways:
- Test retries: When you use the Test Retry plugin, Tuist analyzes each attempt. If a test fails on some attempts but passes on others, it's automatically marked as flaky.
- Cross-run detection: Even without retries, Tuist compares results across different CI runs on the same commit. If a test passes in one run but fails in another, both runs are flagged.
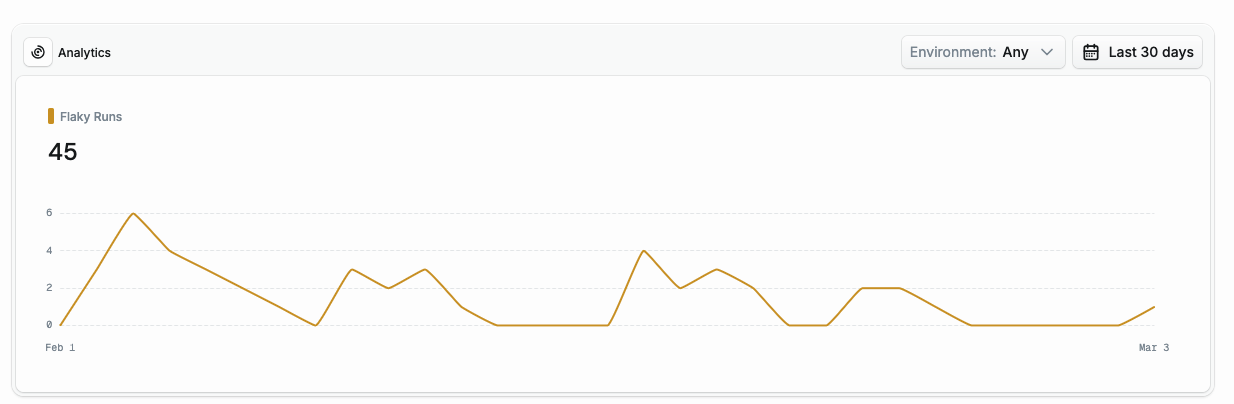
Once detected, flaky tests appear in your project's dashboard where you can track their flakiness rate and drill into individual failures. Tests are automatically cleared after 14 days of stability.
And you don't have to stop at detection. With automatic quarantining, newly detected flaky tests are immediately isolated from your CI pipeline. The Gradle plugin fetches the quarantined test list before each test task and excludes them using Gradle's excludeTestsMatching filter. Your PRs stop getting blocked by tests that have nothing to do with your changes while you investigate the root cause.
Built for automation and agentic workflows
All the data Tuist collects — build insights, test results, flaky test history — is accessible through the CLI and the API. This matters because it makes Tuist a natural fit for the growing world of AI-assisted development.
For example, our fix-flaky-tests skill gives coding agents like Claude Code the context they need to actually fix flaky tests. The agent queries Tuist for flaky test data, analyzes failure patterns, identifies root causes, and applies targeted corrections. Coding agents are only as effective as the context you provide them with and Tuist provides the missing link for tackling these kinds of challenges.
Getting started
First, install the Tuist CLI. Then run tuist init in your Gradle project root and follow the interactive setup. The command handles authentication, project creation, and generates the configuration for you. Then apply the plugin in your settings.gradle.kts:
plugins {
    id("dev.tuist") version "0.2.2"
}
That's it. Build insights and test insights start flowing automatically, and enabling the remote cache is a one-liner in gradle.properties:
org.gradle.caching=true
For the full details, see the Gradle plugin documentation.
Android-specific features
Beyond the Gradle plugin, Tuist also supports features that are particularly useful for Android teams.
Bundle insights
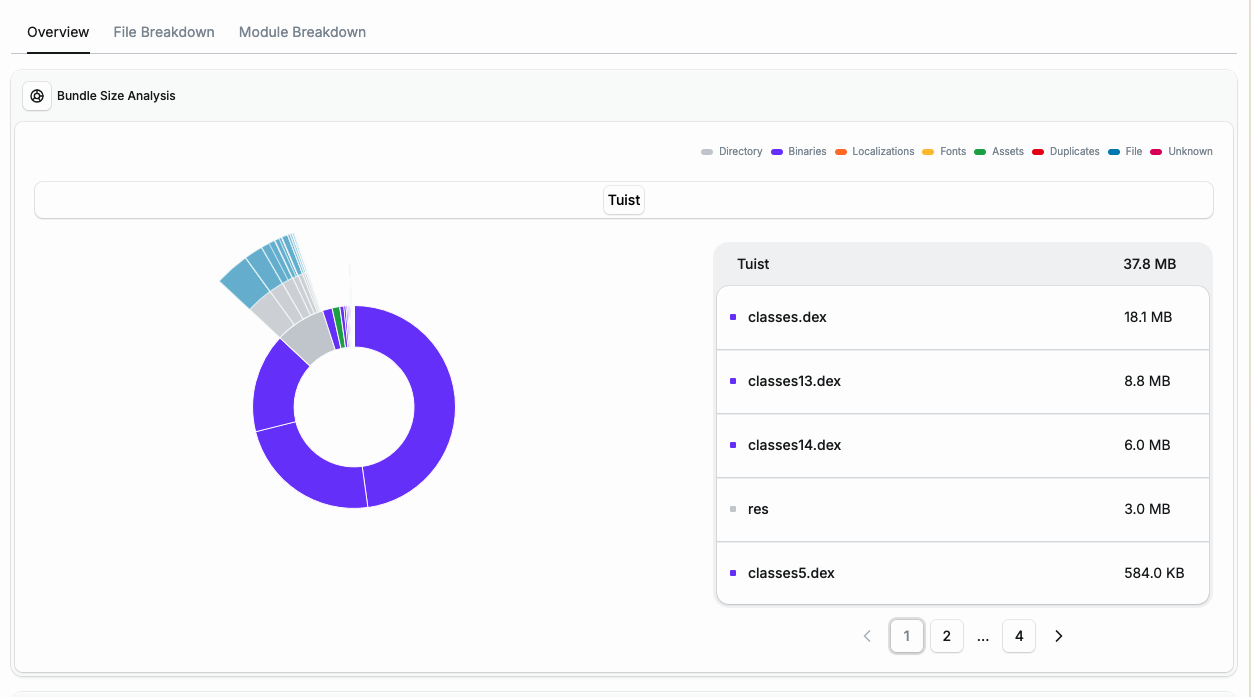
As your app grows, so does your bundle size. Tuist supports analyzing both .aab (recommended) and .apk files:
tuist inspect bundle App.aab
You get a detailed breakdown of your bundle and the bundle size tracked over time. When integrated with GitHub, Tuist posts bundle size analysis directly in your pull requests. You can also get notified directly in Slack with our Slack integration, so your team gets notified about size regressions as soon as they happen, ensuring they get caught before they ship.
You don't need to host anything
One thing we hear from teams evaluating build infrastructure tools: "We don't want to run more servers." We get it.
With Tuist, you don't need to host anything. We host the infrastructure for you, regardless of team size. There's no Gradle remote cache server to maintain, no analytics database to provision, no artifact storage to manage. You install the plugin, authenticate, and everything works.
For teams that do want more control, there are two self-hosting options:
- Self-host everything: Deploy the full Tuist server on your infrastructure. The whole server is source available, so you can inspect exactly what's running. See the self-hosting guide.
- Self-host just the cache nodes: This is especially interesting for teams working from the office or using self-hosted CI runners. You can deploy lightweight cache nodes close to where builds happen while letting Tuist handle the server itself, which is more involved to self-host. See the cache self-hosting guide.
Source available and open
The entire Tuist codebase is source available, and a large part of it is MIT licensed. You can read the source, understand how your data is handled, and contribute if you want. Transparency is a core part of how we build.
And since we dogfood everything we do, we're also using Tuist for our own Gradle-based projects and you can check out the public dashboards of these:
What's next
All of the Gradle features are currently free as our thank you to early supporters. Pricing for the remote cache will come later this year, but for now you can use everything mentioned here at no cost.
We'll continue going deeper into build and test insights. We want to track more data to pinpoint build bottlenecks, monitor CPU usage, and bring native support for test sharding. We're also building a native Tuist Android app (releasing later this month) that will make accessing and running Tuist Previews on Android devices seamless, just like the existing macOS and iOS apps do for Apple platforms. If there's anything your team is missing from the dashboard, let us know and we can prioritize it.
We're excited to bring everything we've learned from scaling Apple platform builds to the Android ecosystem, and to keep growing both sides together.
Reach out to us in our community forum or send us an email at [email protected]. We'd love to hear how you're using Tuist with Gradle.