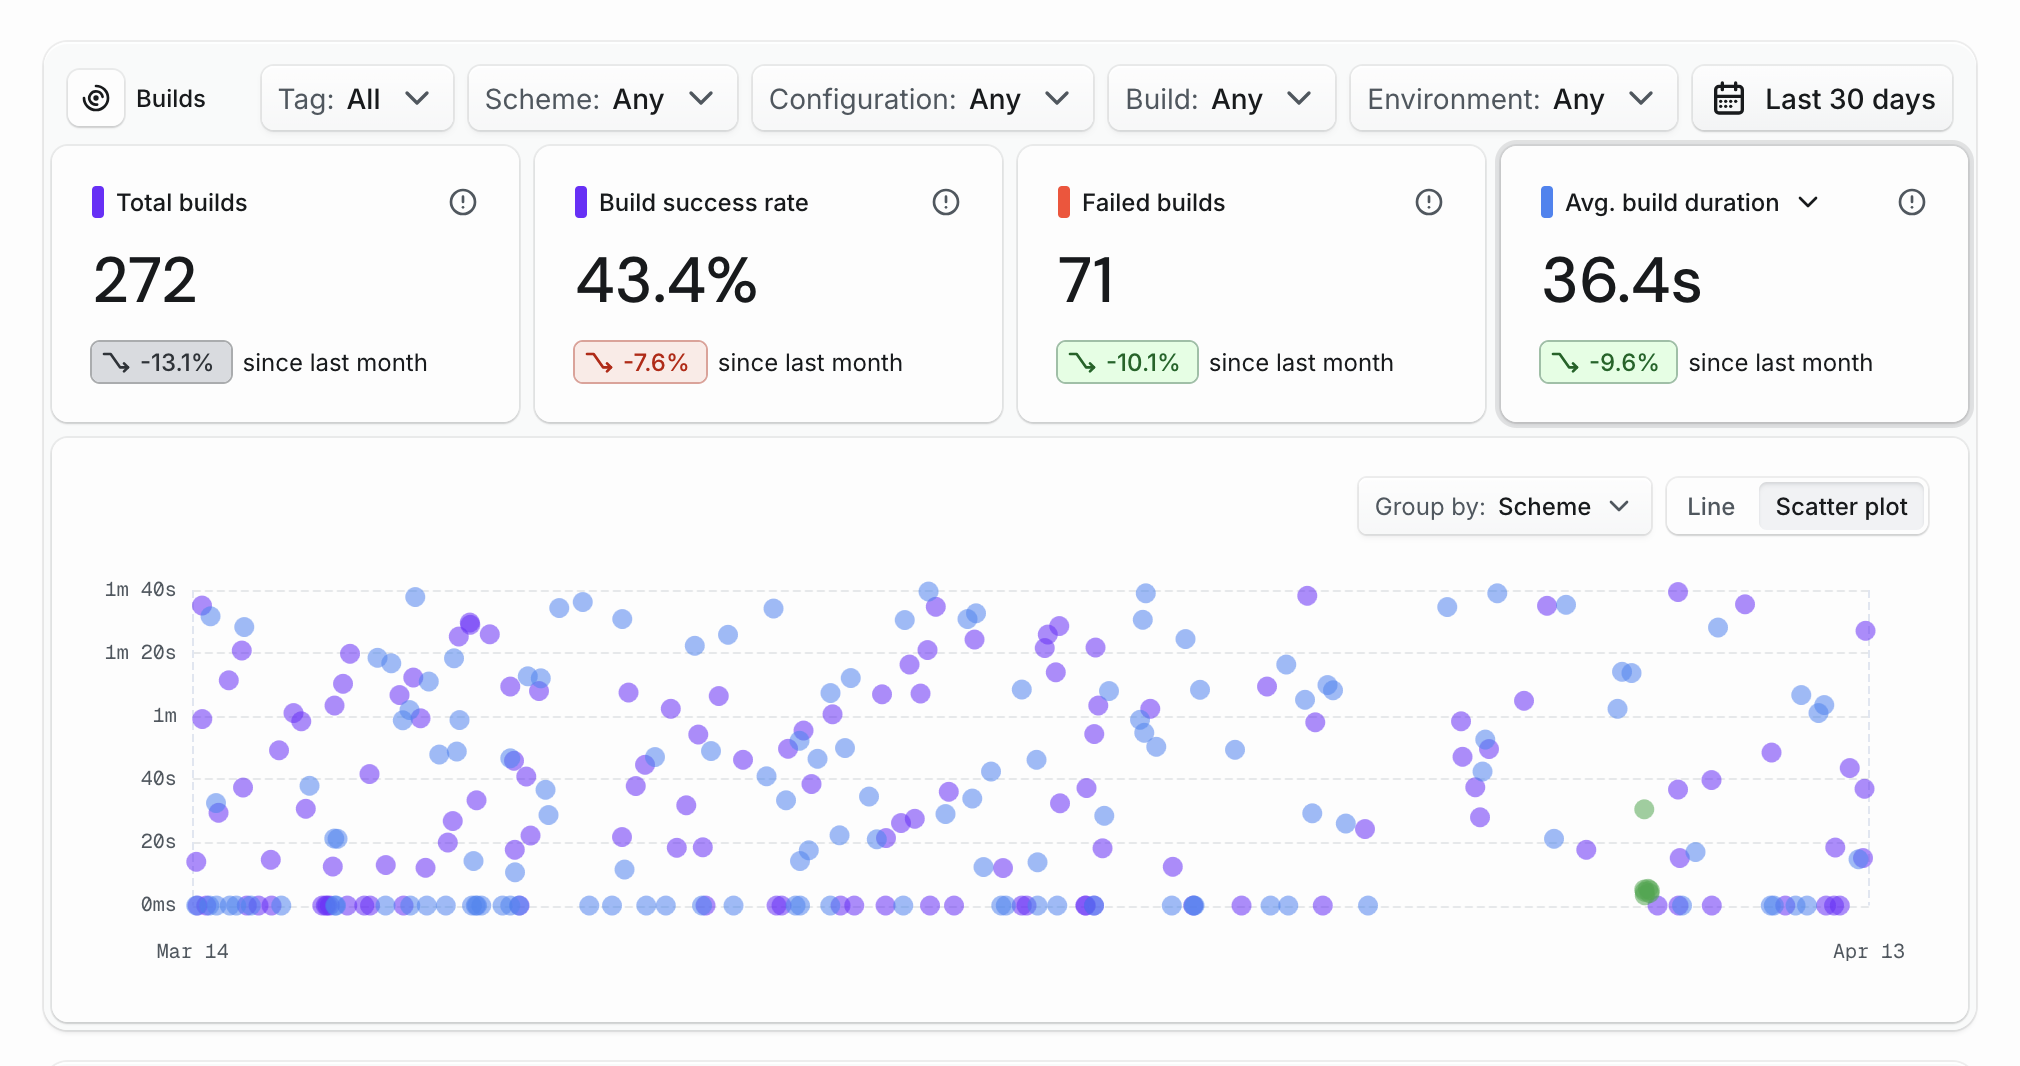
Analytics dashboards now offer a scatter plot view alongside the existing line charts. Toggle between Line and Scatter plot to see individual data points for build durations, test run durations, cache hit rates, and selective testing effectiveness. Use the Group by dropdown to color dots by scheme, environment, or category. Click any dot to jump straight to the detail page.