The test case page reported four numbers for the window you picked: how many times the test ran, how often it flaked, how reliable it was, and how long it took. Each one told you where the test stands. None of them told you how it got there, which is the part you act on. A test at 93% reliability is a different problem depending on whether it has been at 93% all month or fell there on Tuesday.
Every metric is now a chart. Click one and the card draws it across the period, next to what it was over the window before.
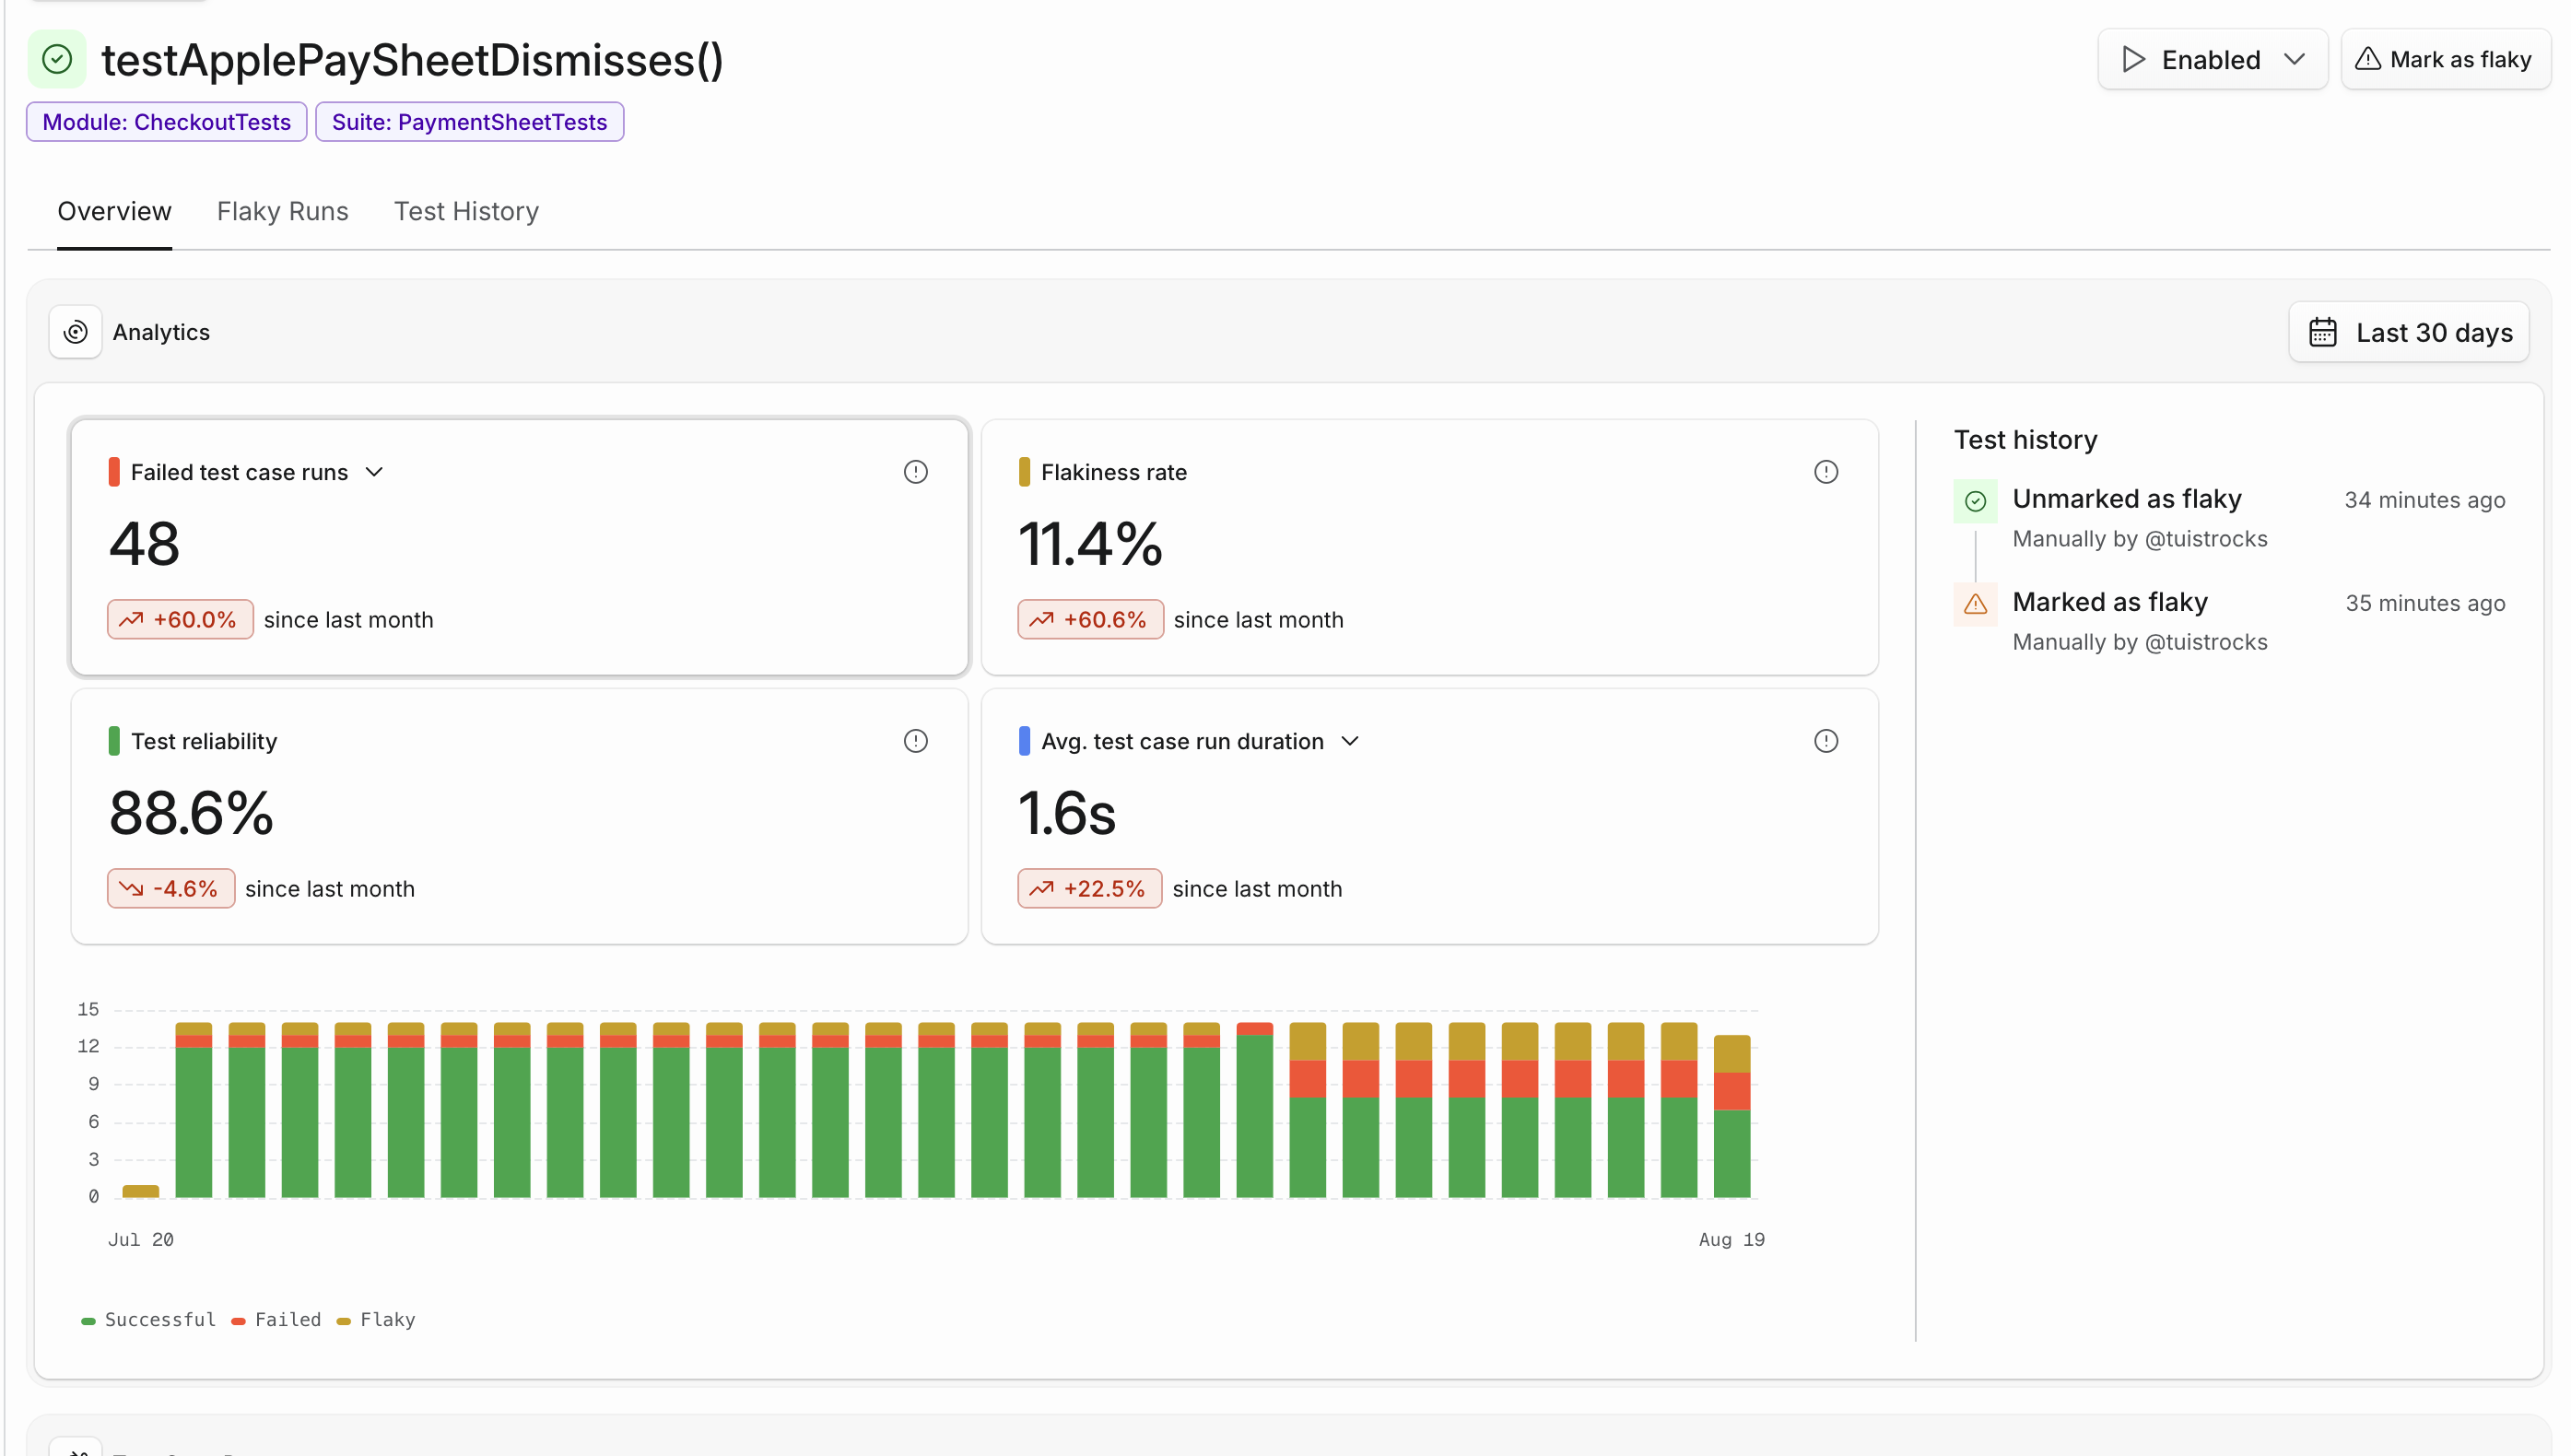
Runs is one bar per day, split by how those runs came out: successful, failed, flaky, quarantined, skipped. The height is the number of runs and the composition is the story. In the run above, three weeks of green give way to red and yellow bands nine days in, which is a regression with a date on it rather than a reliability number that drifted. The widget counts all runs, or just the failed or flaky ones, from a dropdown on its title.
Flakiness rate and reliability are drawn against a fixed 0-100% axis, so a test that sat between 98% and 100% all month reads as steady rather than as a cliff.
Duration draws the average with p50, p90 and p99 together. Reading them side by side separates a test that got slower for everyone from one that is usually fast and occasionally stalls: when the p50 climbs, the test itself changed; when only the p99 climbs, something intermittent did.
The test's own history runs down the side of the card, so a state change and the chart it explains are read together. The day someone quarantined a test sits beside the bars where its failures stopped counting.
Charts follow the date range picker, bucketing by hour, day or month to match the window. Days the test case did not run are gaps in the duration and rate lines rather than a test that suddenly took no time or failed every run, and a period with no runs at all says so instead of drawing a flat line at zero. A window with nothing before it is not a baseline either, so a test case that only started running this week shows no trend rather than a change of nothing.