Kura: a distributed cache for the Tuist module cache, Xcode, Bazel, and Gradle
In 1905, a Hamburg America Line steamer crossed from Hamburg to New York in nine days, while a Hapag-Lloyd container ship on the same route today is scheduled at eleven days and eighteen hours. Moving information has improved rather more: a request from a laptop in Berlin to a server in Virginia resolves in about 350 milliseconds, although that is still a long wait compared with the same request between two machines on one network, which comes back in under a millisecond. For a build cache, that difference matters every time the build system has to ask whether an artifact exists before it can decide what to do next.
It took us some time to internalize how much a remote cache changes the constraints on a build. The build graph determines which work can be skipped, but finding and downloading the cached results takes time of its own, so a build that previously depended on processor speed can end up depending on the latency and bandwidth of its connection to the cache. Large artifacts need a fast transfer, while small artifacts can spend most of their time waiting for the transfer to start; making both fast requires us to understand where the builds run and how to keep useful copies of their artifacts nearby.
This is a familiar problem in content delivery. In 1995, Tim Berners-Lee, then at the Massachusetts Institute of Technology, challenged his colleagues to find a way to relieve congestion on the web, and Tom Leighton took it up with a graduate student named Danny Lewin. Their work led to consistent hashing, which distributes content across a changing set of servers without moving all of it whenever a server joins or leaves, and to the founding of Akamai in 1998. Nearly thirty years later, we were working through a related problem with build artifacts: improving our servers would only take us so far if each request still had to travel to another continent.
The problem became harder to ignore as we added support for build systems that produce very small artifacts, including Xcode's compilation cache and Bazel. Our existing service had been designed around larger downloads, and adapting it exposed limitations in how we managed resources, replicated data, and placed nodes near developers. We eventually decided to replace it, alongside a move to Kubernetes and our own runners that would give us more control over where cache and compute run. The replacement is called Kura, after 蔵, the Japanese word for a storehouse, and understanding its design requires some context about the service it replaces.
Why object storage worked for the module cache
The module cache caches compiled modules for Xcode projects created with the Tuist project generator. Because Tuist knows the dependency graph, it can identify modules that haven't changed, replace them with precompiled binaries, and generate a project that skips compiling them. Those binaries are substantial artifacts, including entire frameworks and compiled modules. Across five million module cache downloads, the median artifact was between 256 and 512 kilobytes, a tenth were larger than 4 megabytes, and one in a hundred exceeded 32 megabytes, with a small fraction larger than 256 megabytes. For this workload, the time spent transferring the artifact mattered much more than the initial lookup, so bandwidth was our main concern.
Object storage was a reasonable fit: it was inexpensive, provided durability, and let us serve large downloads without operating the storage system ourselves. What we hadn't anticipated was how the providers we tried would behave under our request volume. Uploads and downloads began failing between the client and the bucket, which left developers seeing network errors during their builds and left us with little information to explain them. We changed providers and encountered similar problems again; regardless of the cause of each failure, we were responsible for the build experience and had put an important part of it in a system we could neither inspect nor fix ourselves.
There was also a performance constraint that changing providers couldn't remove, which we explored in The physics of build systems. A cache hit costs roughly R × L + S / B, where R is the number of round trips that cannot overlap, L is latency, S is the number of bytes transferred, and B is bandwidth. For a large artifact, the transfer term, S / B, tends to dominate, so object storage can work well even when it is some distance away. As the artifacts get smaller, R × L accounts for more of the cost, and moving the same bytes faster makes little difference because most of the time is spent waiting for a response. Our initial choice had suited the module cache, but it was becoming less suitable for the workloads we were adding.
Why Xcode and Bazel need lower cache latency
Xcode 26 introduced compilation caching built on content-addressable storage, at sub-function granularity, and we integrated with it as soon as it shipped. Instead of downloading a framework, a build could now make thousands of small requests, many of them just to check whether an object existed. The median artifact was between 8 and 16 kilobytes and the 99th percentile was below a megabyte, with twenty-one million lookups over the same period in which the module cache served five million downloads. On the fleet still carrying most of our traffic, the Xcode compilation cache accounted for 80% of requests but only 6% of bytes, with an average download of 60 kilobytes, while the module cache accounted for the remaining 20% of requests and 94% of bytes, averaging 3.8 megabytes per download. We needed the same service to handle both efficiently, even though improving transfer throughput would do little for most of its requests.
Bazel added another workload with many small action lookups and artifact fetches, which also made the cost of object storage harder to predict. Providers charge for operations as well as bytes, and a build that performs tens of thousands of reads and writes can produce a substantial bill without storing very much data. The operation count depends on the project's structure: a graph with many small modules produces more, smaller artifacts than a coarser graph, so two accounts on the same plan can cost us very different amounts to serve. Encouraging teams to split their projects into smaller modules was good for their builds, but it could also make them more expensive for us to support, at a time when we were already struggling with reliability and latency.
Adding regional caches in front of object storage
Our first attempt to address these problems, built between November 2025 and the spring, was a cache service written in Elixir and running as a Phoenix application on ten cloud virtual machines across eight regions. Each node kept a local copy of artifacts on a volume mounted at /cas, while object storage held the authoritative copy. On a read, nginx asked Phoenix to authorize the request through auth_request, received an X-Accel-Redirect pointing to the file, and served it through sendfile with kernel Transport Layer Security, so the artifact bytes did not pass through the Phoenix application. SQLite tracked access metadata for eviction, Cachex held key-value data and authorization results, and Oban workers handled eviction, orphan cleanup, and transfers to and from the bucket. We configured the hosts with NixOS and deployed the application with Kamal, using tools we already understood and could operate with a small team.
The service improved local reads, and a version of it still serves the majority of our traffic while we migrate, but its replication model introduced a cost that grew with our regional coverage. If an artifact was needed in several regions, every region fetched its own copy from object storage, so we paid for the same artifact to leave the bucket several times. Adding a region could improve latency for a customer's developers while also increasing the cost of serving that customer, even when their builds were all using the same artifacts.
Local copies were also less effective for the module cache than we had expected. Disk served 48% of module cache reads, which meant that more than half of the requests for our largest artifacts still went to object storage through a cache node. The Xcode compilation cache did much better at 97%, since its smaller artifacts allowed a useful working set to stay on disk. A local miss nevertheless had the same limitation in both cases: the node had to wait for a system we didn't operate, and increasing disk capacity was the main way we could improve the odds of avoiding that wait.
The limits of our first regional cache service
I remember standing in the airport in Chicago with Marek, waiting for a flight home from Deep Dish Swift, and agreeing that we needed to reconsider the design. We'd spent months working on individual failures and performance problems, but several of them came from assumptions shared by the whole service, and continuing to patch them was becoming difficult to justify. Looking back, five problems explain most of what we changed.
We hadn't bounded resource use. The service allocated memory as work arrived, and under enough load it could allocate more than the machine had and get restarted. Moving eviction, orphan detection, and bucket transfers into Oban workers gave us control over when those jobs ran, but it didn't limit the resources each job used or account for allocations on the request path. The host configuration still contains evidence of this, including swap kept as an out-of-memory shock absorber for transient spikes. Scheduling background work helped, but we had mistaken that improvement for control over the node's total resource use.
We hadn't bounded what an individual account could consume. The hosts served multiple accounts, so a team uploading a large module cache artifact could saturate a node's bandwidth and slow builds for everyone else using it. We tried to improve fairness within the existing design, including limiting the bytes nginx could hand to sendfile in one call so a large transfer wouldn't monopolize a worker between smaller requests. That helped with a particular symptom, but we still had no way to reserve capacity for an account or enforce a limit on its total use of the node.
We couldn't reproduce the infrastructure locally. Our development setup consisted of one cache node with nginx in front, which was enough to verify that a request returned the expected bytes but couldn't tell us how the fleet would behave when a region became unreachable, a node started with an empty disk, or a rollout left nodes on different versions. We had to investigate those situations in production, where experiments were slower and the consequences affected real builds, so some of the most important properties of the system were also the hardest for us to test.
Host and application changes had different deployment behavior. NixOS managed the operating system and Kamal deployed the application containers, so an application release could preserve the warm cache while changes to kernel parameters, disk configuration, or the nginx build required taking the server out of rotation. Bringing that node back meant rebuilding its working set from object storage, and developers using the region experienced the slower reads while it warmed. We had a workable process for releasing application code, but changes elsewhere in the stack could still have a noticeable effect on builds.
The underlying hardware added variability we couldn't explain. Our cloud virtual machines shared physical hosts with workloads we couldn't see, while predictable disk latency and network throughput were essential to the service we were trying to provide. When either changed, we had to determine whether the cause was in our application, our configuration, or the infrastructure underneath us before we could begin fixing it. We'd been trying to isolate our customers from each other's workloads without having equivalent control over the resources available to our own service.
Introducing Kura, Tuist's distributed build cache
We continued the conversation on the flight home, through a layover in Reykjavík, and had a plan by the time we landed in Berlin. We wanted to be able to say how much memory, bandwidth, and disk an account should receive, and to place those resources near the account's builds. The old service had no consistent way to express those decisions: available capacity depended on who else was using a node, and placement depended on which regions we'd provisioned. Those were reasonable shortcuts when we started, but they made it difficult to offer predictable performance or understand the cost of serving an account.
Kura is the Rust implementation of that plan, released under the GNU Affero General Public License, version 3. Local disk is the source of truth, nodes replicate directly with peers, and serving an artifact no longer depends on object storage. Owning storage, replication, and serving has made it about seven times the size of the service it replaces, which is a significant maintenance commitment for us. We drew on Buildbarn, particularly its composition of mirrored, read-fallback, and sharded storage backends, as a reference for separating responsibilities within a cache rather than concentrating them in one storage implementation.
The resource model gives each account a minimum allocation that other accounts cannot consume, together with a ceiling that limits how much a burst can take from the host. Placement becomes an explicit decision based on where the account builds, and direct replication lets nodes exchange artifacts without paying for each region to retrieve its own copy from a bucket. These choices also affect which plans we can offer: if the cost of an artifact follows it into every region, we either absorb that cost or charge more to teams whose developers work in several places. We wanted smaller teams to benefit from nearby caches too, without a minimum price imposed by the storage architecture before we'd even decided what their plan should include.
A solo developer on the cheapest plan should get a cache that sits close to where they build. A team that needs it closer should be able to put a node in their own datacenter, or near its build machines.
Inside Kura's cache architecture
We ran each iteration against our own builds before introducing it to customers, which gave us a way to exercise the design as both its operators and its users. A node needed to adapt to the resources available to it, keep client requests responsive while replicating with peers, and report when an account was running out of capacity. That last part matters beyond scheduling: the same information can tell us when to talk to a customer about their needs, before slower builds become the way they discover a limit. The rest of the design follows from making those requirements concrete, starting with control over memory and disk.
Why we chose Rust for predictable cache latency
Rust gave us explicit control over allocation and ownership, which we needed to enforce a memory budget across the lifetime of a request. A response reserves its buffers before opening a reader, keeps that reservation attached to the response body, and releases it when the last transport owner drops it; file-backed responses can use memory mappings without first copying their contents into application buffers. We also need to retain useful pages in the operating system's cache while releasing pages we no longer expect to read. These decisions depend on knowing which operation owns memory and when it can be reclaimed, and Rust's ownership model lets us express that directly in the implementation. Avoiding garbage collection also removes collection pauses as a source of latency, although predictable response times still require us to bound allocations, queueing, and background work throughout the node.
Storing metadata in RocksDB and artifacts on disk
Before Kura can serve an artifact, it needs to find it on disk and determine its size, so it maintains records describing the artifacts stored on each node. It also stores the key-value data that teams write directly, the state of unfinished multipart uploads, deletion records for namespaces, and the index that maps Bazel actions to their cached results. These records need to survive restarts and support frequent lookups and updates, which makes an embedded database a useful fit: the node can retrieve the information it needs without contacting another server before reading the artifact.
We use RocksDB, an embedded key-value store that keeps keys in sorted order and supports separate write and compaction settings through column families. Kura has ten of these keyspaces, allowing us to configure the action-cache index separately from the replication outbox and other records with different access patterns. Most artifact contents live in append-only segment files that the serving code opens directly, while small objects and action-cache entries can be stored inline in RocksDB to avoid a separate file access for a small amount of data. This gives us different storage paths for record lookups and large transfers, with settings appropriate to each workload, although both still share the node's disk and memory budget.
The segment files form a ring within a disk allocation that defaults to half the node's disk and is capped at 80%. Segments pass through three bands as they age: newly written segments, current segments, and an old band that occupies a fifth of the ring. When space is needed, the node unlinks the oldest segment, reclaiming a file containing many artifacts without deleting each artifact individually. Unlinking is important because a reader may still have the file mapped into memory: removing its name lets an existing reader finish, whereas truncating the file beneath a live mapping can crash the process. To retain frequently read artifacts, a read from the old band copies the artifact into a fresh segment, where it participates in the normal eviction order again. The copy persists across restarts and gives recently used artifacts another pass through the ring; the size of the old band determines how much of the stored data is eligible for this treatment.
- Unlink operations
- 0
- Artifacts reclaimed
- 0
- Last reclaim
- waiting for the head to fill
Artifacts are appended to the newest segment. When it fills, the ring rotates and the
oldest segment is removed in a single unlink, taking every artifact inside
it at once. Eviction never visits an individual artifact, which is why its cost does not
grow with how many the segment happened to hold.
Bounding cache memory use under load
A node divides its memory between serving requests and several caches, including RocksDB's block cache and write buffers, artifact manifests, action-cache snapshots, existence lookups, and open file descriptors for immutable segments. We size those caches from the memory guaranteed to the node, which in Kubernetes is its memory request, rather than from the higher limit at which it may be killed. If caches are sized from a limit several times larger than the request, they can consume the entire guaranteed allocation and leave no room for response buffers, producing a node that passes its health checks but cannot admit client work. At startup, Kura fits the caches to the guaranteed allocation, shrinking them proportionally while retaining a minimum for each, and logs the adjustments so we can see how the available memory was divided.
Every response stream, upload, and materialized response reserves memory before it starts, so the node can refuse work it cannot afford instead of accepting it and failing partway through. A read that cannot obtain a reservation receives status 429 with a Retry-After header, while server error responses remain an indication that something has failed rather than that the node is busy. Each account also gets its own mesh of nodes in the regions where its builds run, isolating its cache from other accounts and keeping its disk allocation available for its own working set. Together, these bounds let us control both the resources available to an account and the work admitted within each of its nodes.
Serving large and small artifacts
For large artifacts, we focused on reducing work in the serving path and avoiding repeated transfers after a connection fails. An unencrypted read that passes authorization and resolves to a local file can be served through splice or sendfile on the same port, without copying the artifact contents into application buffers, while other requests use the normal serving path. The old service already used sendfile through nginx, but authorization and file serving belonged to separate processes connected by a subrequest; Kura owns both decisions and can select the file-serving path within the same process. This preserves the efficient transfer behavior while putting it under the same resource controls as the rest of the node.
We also configure HTTP/2 flow-control windows explicitly, because an adaptive window that starts small takes time to grow on a high-latency connection. At a round-trip time of 100 milliseconds, we measured 9.84 megabytes per second with the adaptive implementation and 20.65 megabytes per second with a fixed window. Downloads support byte ranges as well, allowing a client whose connection fails near the end of a transfer to request the remaining bytes instead of downloading the entire artifact again. Both changes matter when the developer's connection is slow or unreliable, where restarting a transfer or gradually increasing its throughput can cost more time than the storage lookup itself.
Small artifacts need fewer round trips as well as nearby storage, so the action cache can return a snapshot of a namespace's key-to-value map in one response, deduplicated and accompanied by a watermark. A cold client can load the associations it needs in one request, fetch the contents through batched reads, and use the watermark to ask for subsequent changes. We also have a protocol extension for clients such as the Xcode cache plugin that cannot know their output paths ahead of time, allowing them to combine a lookup and fetch that would otherwise require two requests. Once artifacts are local, these protocol changes give us a way to reduce the waiting that remains; improving the disk cannot remove the network round trips required by the client.
Distributing the build cache across regions
Many of the teams we work with build in more than one place, whether that means Mac machines in us-east and developers in Berlin, or offices running Gradle and Bazel builds across several regions. Kura therefore needs to work as a distributed cache, with nodes exchanging artifacts directly and a control plane deciding where to place them. Supporting that model helped motivate our move to Kubernetes, which deserves a post of its own: allocating resources, placing instances, and retiring them are scheduling decisions, and we wanted a system where we could describe those decisions explicitly and reconcile them as demand changed.
Peer replication and cold starts
Each node reads a bounded change feed from its peers and requests the artifacts it is missing, so a write adds one feed row regardless of the number of peers that will eventually consume it. Because receivers initiate the transfer, they can check whether they already have an artifact before any contents are sent, and one gateway per region exchanges data with other regions so transfers across a regional boundary do not multiply with the number of local nodes. Replication is leaderless and uses last-writer-wins conflict resolution, allowing each node to accept writes from its clients without waiting for other regions to acknowledge them. Peers catch up independently, so accepting a write does not imply that every peer can serve it immediately.
A new node, or one that has been offline, walks each peer's index from newest to oldest and fetches the contents it is missing, recording a durable watermark that advances only when a pass completes. If the node restarts, it can resume from that watermark rather than beginning the entire scan again. This gives us a way to populate a new region from an existing peer's working set before clients have individually requested every artifact, addressing the slow warmup we had with the old service. Replication also adjusts to the number of client requests in flight and their recent latency, using available bandwidth while a node is quiet and reducing its activity when clients need the capacity.
Placing cache nodes near developers
We didn't want to ask teams to choose a region for their cache when we can derive that information from where their builds run, or make them responsible for revisiting that choice whenever they open an office or move their build machines. An account's first instance is placed wherever capacity is available while we gather enough build history to guide the decision, after which the control plane can move it closer to the account's builds and add instances in other regions with sustained demand. Placement changes require a consistent pattern of activity, and moves are deliberately infrequent, so a temporary burst of builds in another location doesn't cause the cache to move away from the developers who normally use it.
We assess demand in each additional region independently, so a smaller office can justify a nearby cache even when another office produces most of the company's builds. Once an instance is running, activity has to fall substantially below the level that justified creating it before we consider retiring it, which prevents ordinary fluctuations from repeatedly adding and removing the same cache. The observation windows also account for quiet weekends, allowing placement to follow lasting changes in how a team works while keeping its cache stable from one build to the next.
- Instances live
- 0
- Provisioned
- 0
- Retired
- 0
A region earns an instance when the account's traffic there clears the upper threshold, and loses it when traffic falls under the much lower one. Setting them apart is what stops an account on the boundary from being provisioned and retired over and over, and it is why a quiet fortnight is not enough on its own to take a region away.
Scaling cache capacity and rolling out updates
We put particular care into choosing metrics that guide placement and resource sizing, from where an account's builds run to how quickly requests complete and which resources are under pressure. Those measurements tell us when to add capacity to keep responses fast and artifacts available for reuse, and when we can reduce an allocation to control costs without compromising that experience. We wanted these adjustments to follow observed demand, without asking teams to estimate their infrastructure needs or keep revisiting them as their projects grow.
For disk capacity, the age of the oldest segment tells us how long artifacts survive before eviction under the account's current storage demand. Short retention is a reason to increase capacity, while an allocation that never experiences eviction is a candidate for reduction. The controller responds sooner to severe pressure, so an account losing useful cache entries can receive more disk while less urgent changes go through a longer observation period.
We also invested in rollout systems that let us detect problems in production and return quickly to a version we trust. Kura follows a progressive delivery approach, releasing through waves of accounts with health checks between them, starting with our own account and then moving through customers in order of recent traffic, smallest first. We can stop a rollout when something goes wrong, with newly provisioned nodes respecting the same pause, and deploy a trusted version without waiting for the normal progression through waves, reducing the time developers spend affected while we investigate.
Each wave includes whole accounts, including their self-hosted nodes, so customer-operated hardware upgrades alongside the nodes we manage. This avoids assigning parts of the same mesh to different release waves, which would leave them on different versions for longer and complicate debugging. Customers can place a node beside their own build machines and have it replicate and upgrade as part of the managed mesh, retaining control over its location without having to maintain a separate release process.
Colocating caches with runners and self-hosted nodes
When we started building Kura, we noticed how often caching was offered as an add-on to compute, with the cache tied to the infrastructure where a team ran its builds. We wanted caching and compute to be independent layers, useful separately and able to take full advantage of colocation when operated together. That is why we built a global cache infrastructure that we'll continue to expand with new regions, and why we designed the mesh to include nodes that accounts deploy themselves, whether in an office or alongside their own build infrastructure. A team should be able to bring the cache closer to its builds without having to move those builds to our machines.
That becomes trickier when another company operates the build infrastructure, because placing a cache service beside the runners depends on the provider being willing to accommodate it. We are, which is why Tuist Runners provisions a Kura node alongside an account's runners, on the same network and without separate cache configuration. The node participates in the account's mesh like any other instance, so artifacts produced on our hardware can replicate to the regions where the team's developers work and to nodes they operate themselves. Colocation gives the runners a short path to the cache, while replication makes the same results useful to the next person building that branch on a laptop.
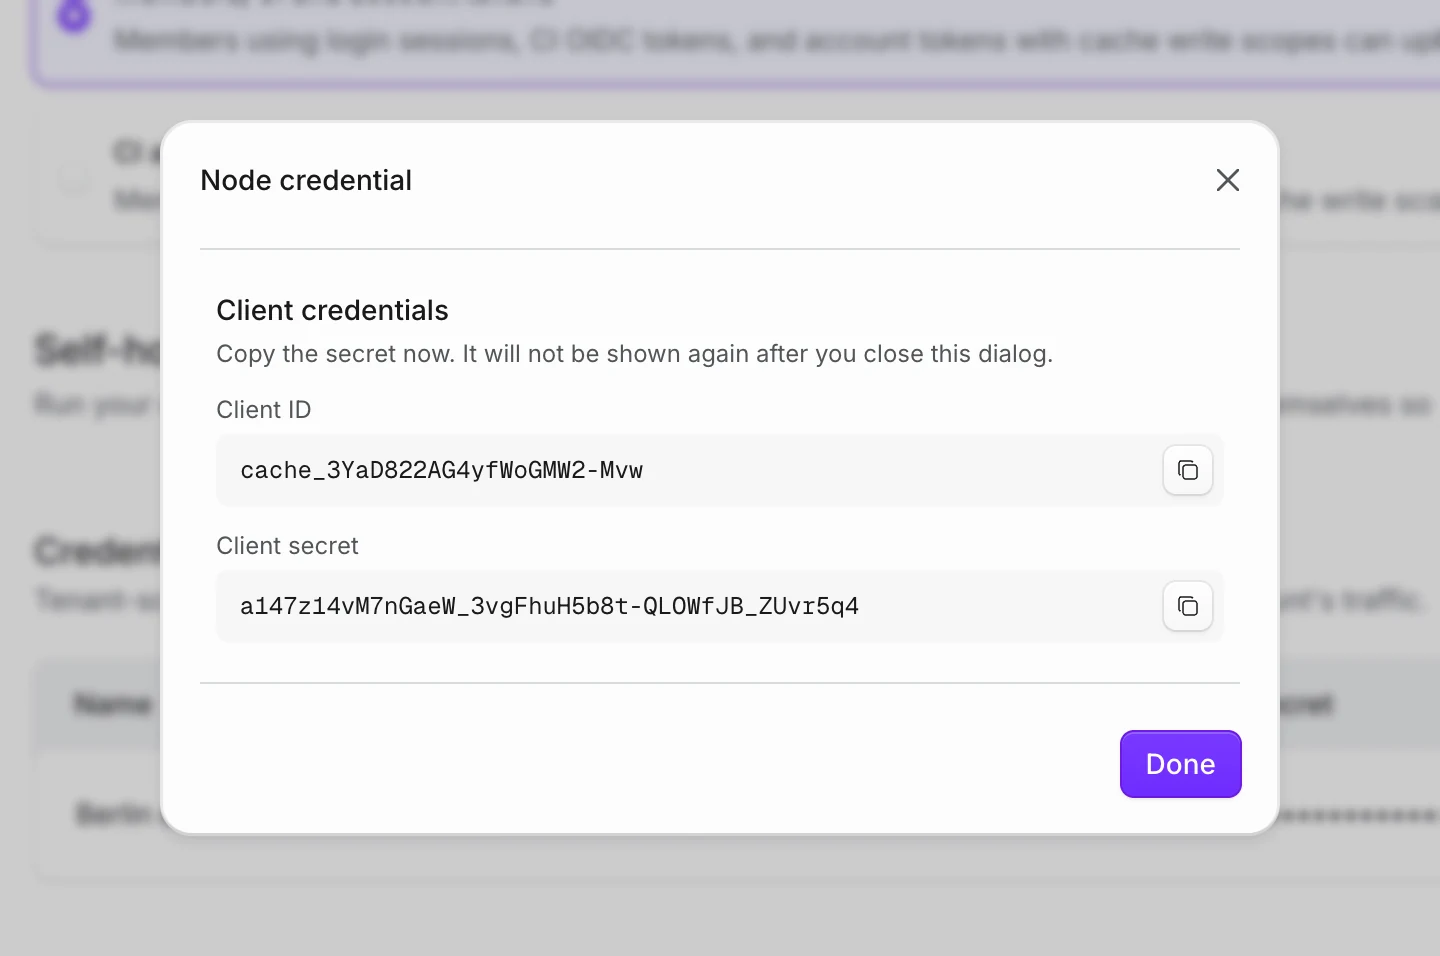
If your team builds on machines in an office or on infrastructure you operate, a self-hosted node lets those machines fetch artifacts over the local network while sharing cached results with the rest of your account. You can bring the cache closer without moving your builds or operating a separate caching system. To add that node, you start in the dashboard by generating a credential for your account. Following the self-hosting setup, you give the node that credential, a persistent data directory, and the addresses its peers and clients can reach, then run the Kura executable or its container image with enrollment and registration enabled. At startup, the runtime derives resource defaults from the memory, processors, and disk available to it, enrolls with the account, and registers its endpoint. An office server can then join the same mesh as our managed regions and your runners, extending the cache to a location you chose while sharing the artifacts already available elsewhere.
A cache for every developer
We tied the migration to an update of the Tuist command-line tool, which enables Kura routing by default, so teams could move to the new infrastructure as they updated their existing setup. Large engineering teams have started using it for their builds, and we use it ourselves too. We're now ramping up the rollout, bringing more accounts onto Kura as teams update and we expand the infrastructure to support them. Seeing it serve different projects and workloads is an encouraging result after the work that went into it, and gives us more experience to draw on as adoption grows.
Getting the resource bounds right was one of the hardest engineering challenges in building Kura, and it took several iterations to arrive at a design we were comfortable operating for other teams. We had to account for the work a node does while serving requests, replicating artifacts, and reclaiming space, while building the Kubernetes foundation that lets us place and operate those nodes across regions. We're proud of what we've put together, and happy with where those iterations led us, even as real workloads continue to teach us where to improve it. We're now increasing capacity in existing regions and adding new ones to meet the cache demands of developers and organizations building with Tuist.
What we want is for any developer to ask their coding agent to set up Tuist for a project and start benefiting from caching right away, whether the next build runs on a laptop, their company's machines, or a hosted runner. Making that possible means treating caching as a global infrastructure problem, with useful artifacts available wherever a developer needs them and access that doesn't depend on buying compute from the same provider. Kura brings us closer to that goal, giving us a foundation we can keep extending as more developers, build systems, and regions become part of it.
If you'd like to opt into the new cache, update the Tuist command-line tool to 4.207.0 or later. From that version, cache traffic is routed through Kura by default, so updating is all it takes to start using it.
If this resonates with you and you'd like us to help optimize your setup, let's chat. Making builds faster is a problem we're obsessed with, and we love working with teams to understand how they build, explore new toolchains, and figure out where caching can make a difference, whether they're starting a new project or improving a setup they've relied on for years.