A slow build tells you where to start looking. The new Tasks page shows which Gradle tasks take the most time across builds, how often they execute, and how often they hit the cache.
Sort tasks by cumulative time to find repeated work that adds up, or compare p50, p90, and p99 durations to spot tasks with slow outliers. Filter by branch or environment to focus on the builds you want to improve.
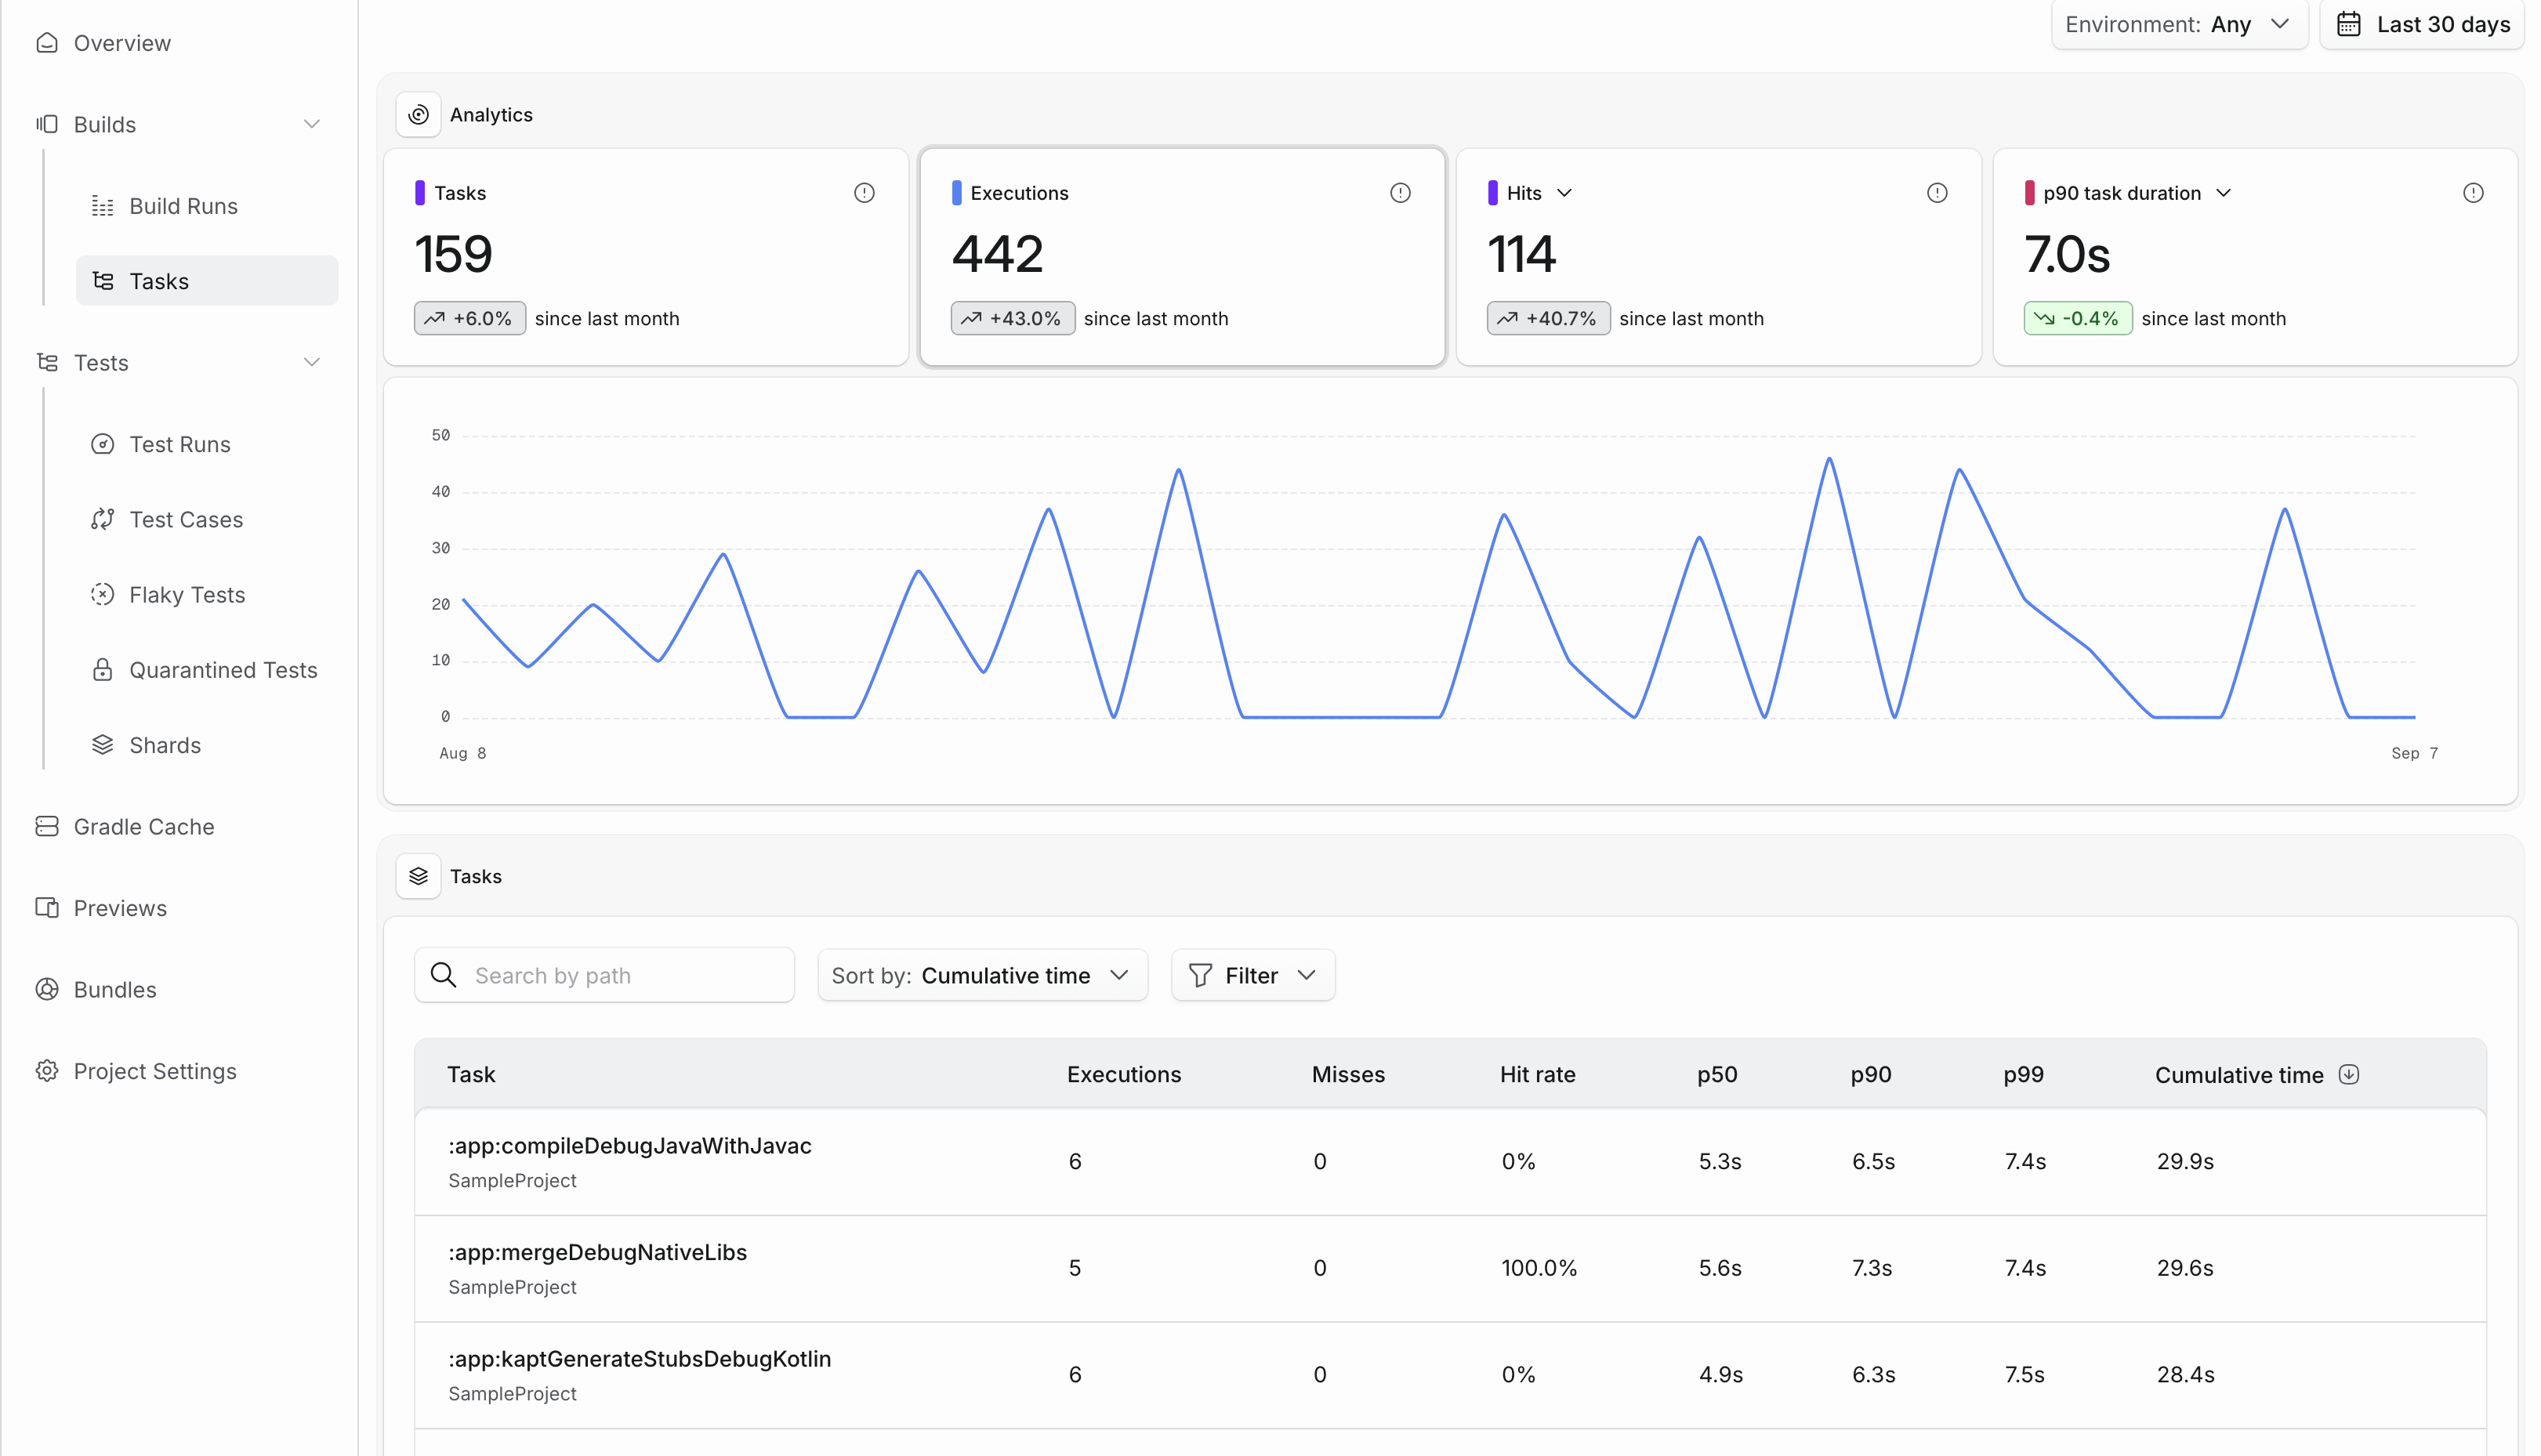
Select a widget to explore execution trends, cache hit rates, or average and percentile durations over time. Open a task to inspect its individual executions, including outcomes and durations, then inspect an execution’s cache behavior and timing. Execution details link to the build behind them and back to the task overview.
Find it under Builds > Tasks in your Gradle project.