Earlier this year, we announced Build Insights – the best way to understand your Xcode builds in local and CI environments. But teams were still kept in the dark about their tests. Tuist Test Insights adds Xcode test analytics to fill that gap.
As your test suite grows, you will inevitably face pains like slow test suites or flaky tests. Additionally, debugging issues on the CI has always been a challenge – can't I get a link that tells me exactly what went wrong, instead of trying to understand the logs, running the tests locally, or downloading the .xcresult?
Test Insights gives you a comprehensive overview of your overall test suite over time along with a detailed report of every test run to ensure your test suite is healthy and is not slowing down your development. No one wants to be waiting an eternity for a CI pipeline to finish only for it to fail with a cryptic error message.
👉 If you'd like to see it in action, check out the video below:
Getting started
To get started with test insights, you will need a Tuist account and a project. The best way to get started is to use our CLI and run the tuist init command.
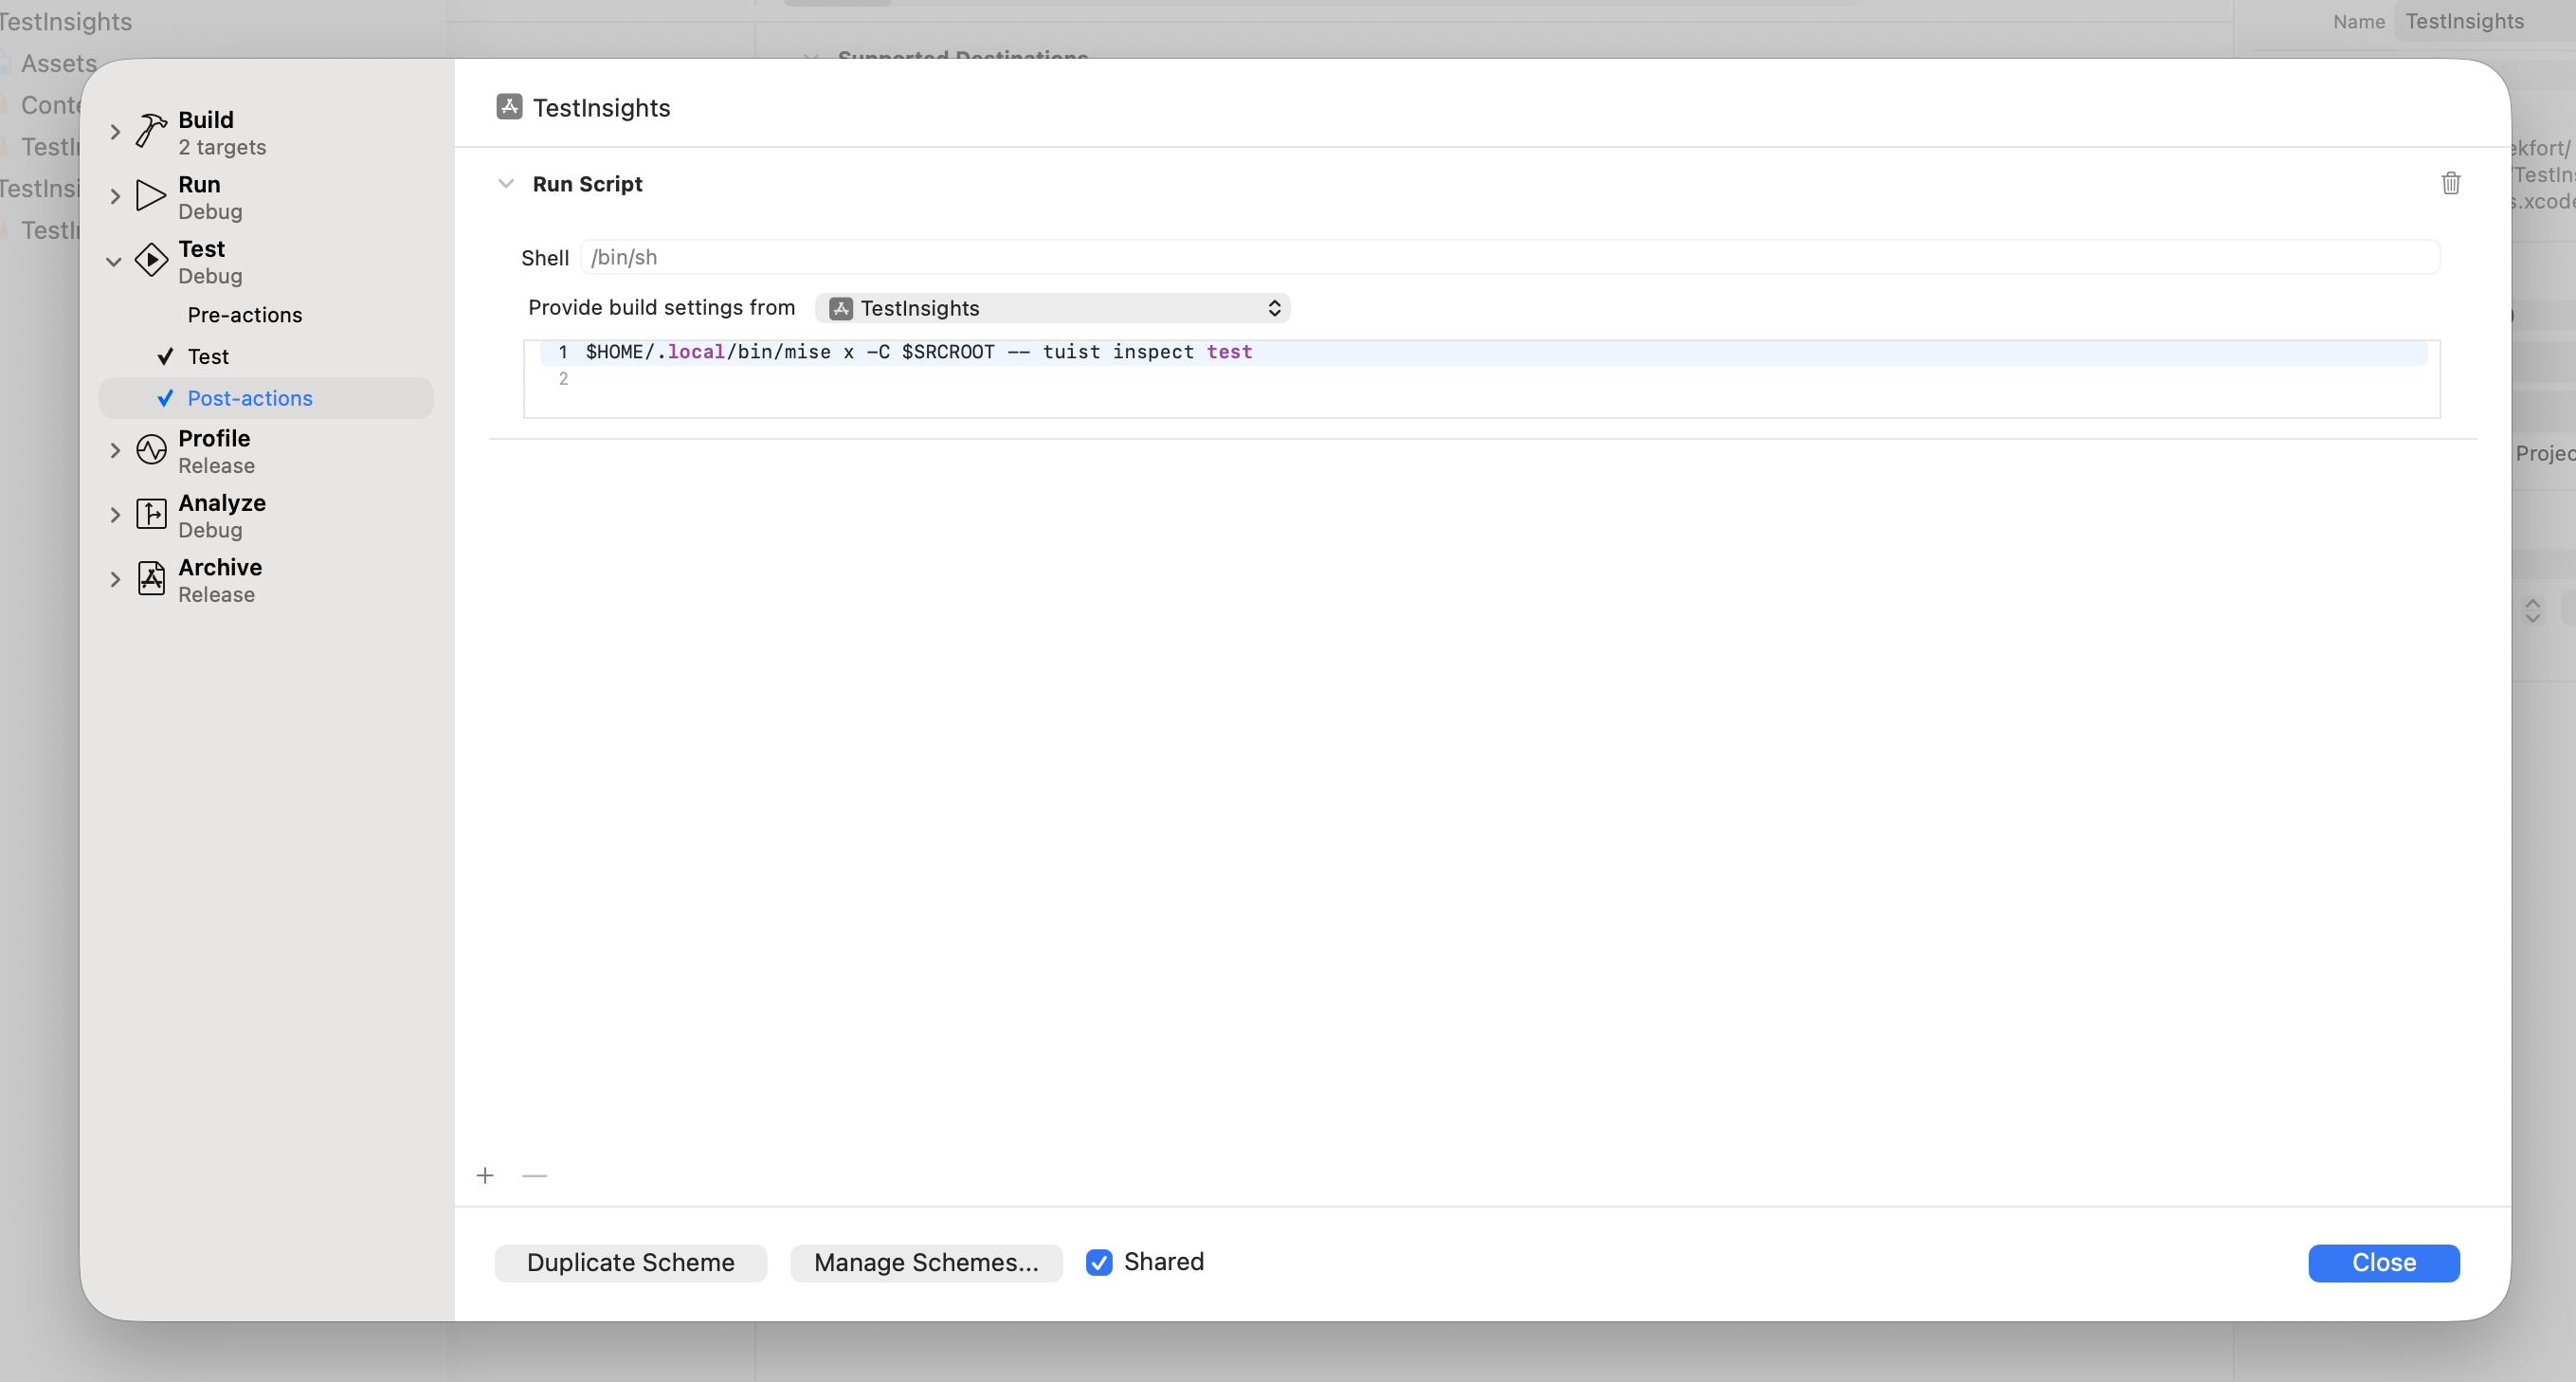
Once you authenticate, you will need to add a tuist inspect test command in your Xcode scheme test post-action – unless you use generated projects, in which case we generate the post-action for you. Note that the exact script depends on your installation. If you use mise, the full script should be:
$HOME/.local/bin/mise x -C $SRCROOT -- tuist inspect test
For more details how to set up test insights, head over to our docs.
Test detail
Once you start tracking tests both on the CI and in your local environments, things start to get interesting. Let's imagine the following scenario:
- your test fails
- you look into your CI logs, but the
xcodebuildlog doesn't include the exact test failure, only which test failed - you try to reproduce locally, but the test passes
- you need to update your CI pipeline to upload the
.xcresultand re-run the test - the test may (or may not) fail again – in case, it does, you can finally download the
.xcresultand investigate the failure in Xcode
So. Much. Friction. Wouldn't it be awesome if you would get a link to your failed test directly in the PR or in your CI logs? That's exactly what you'll get with test insights:
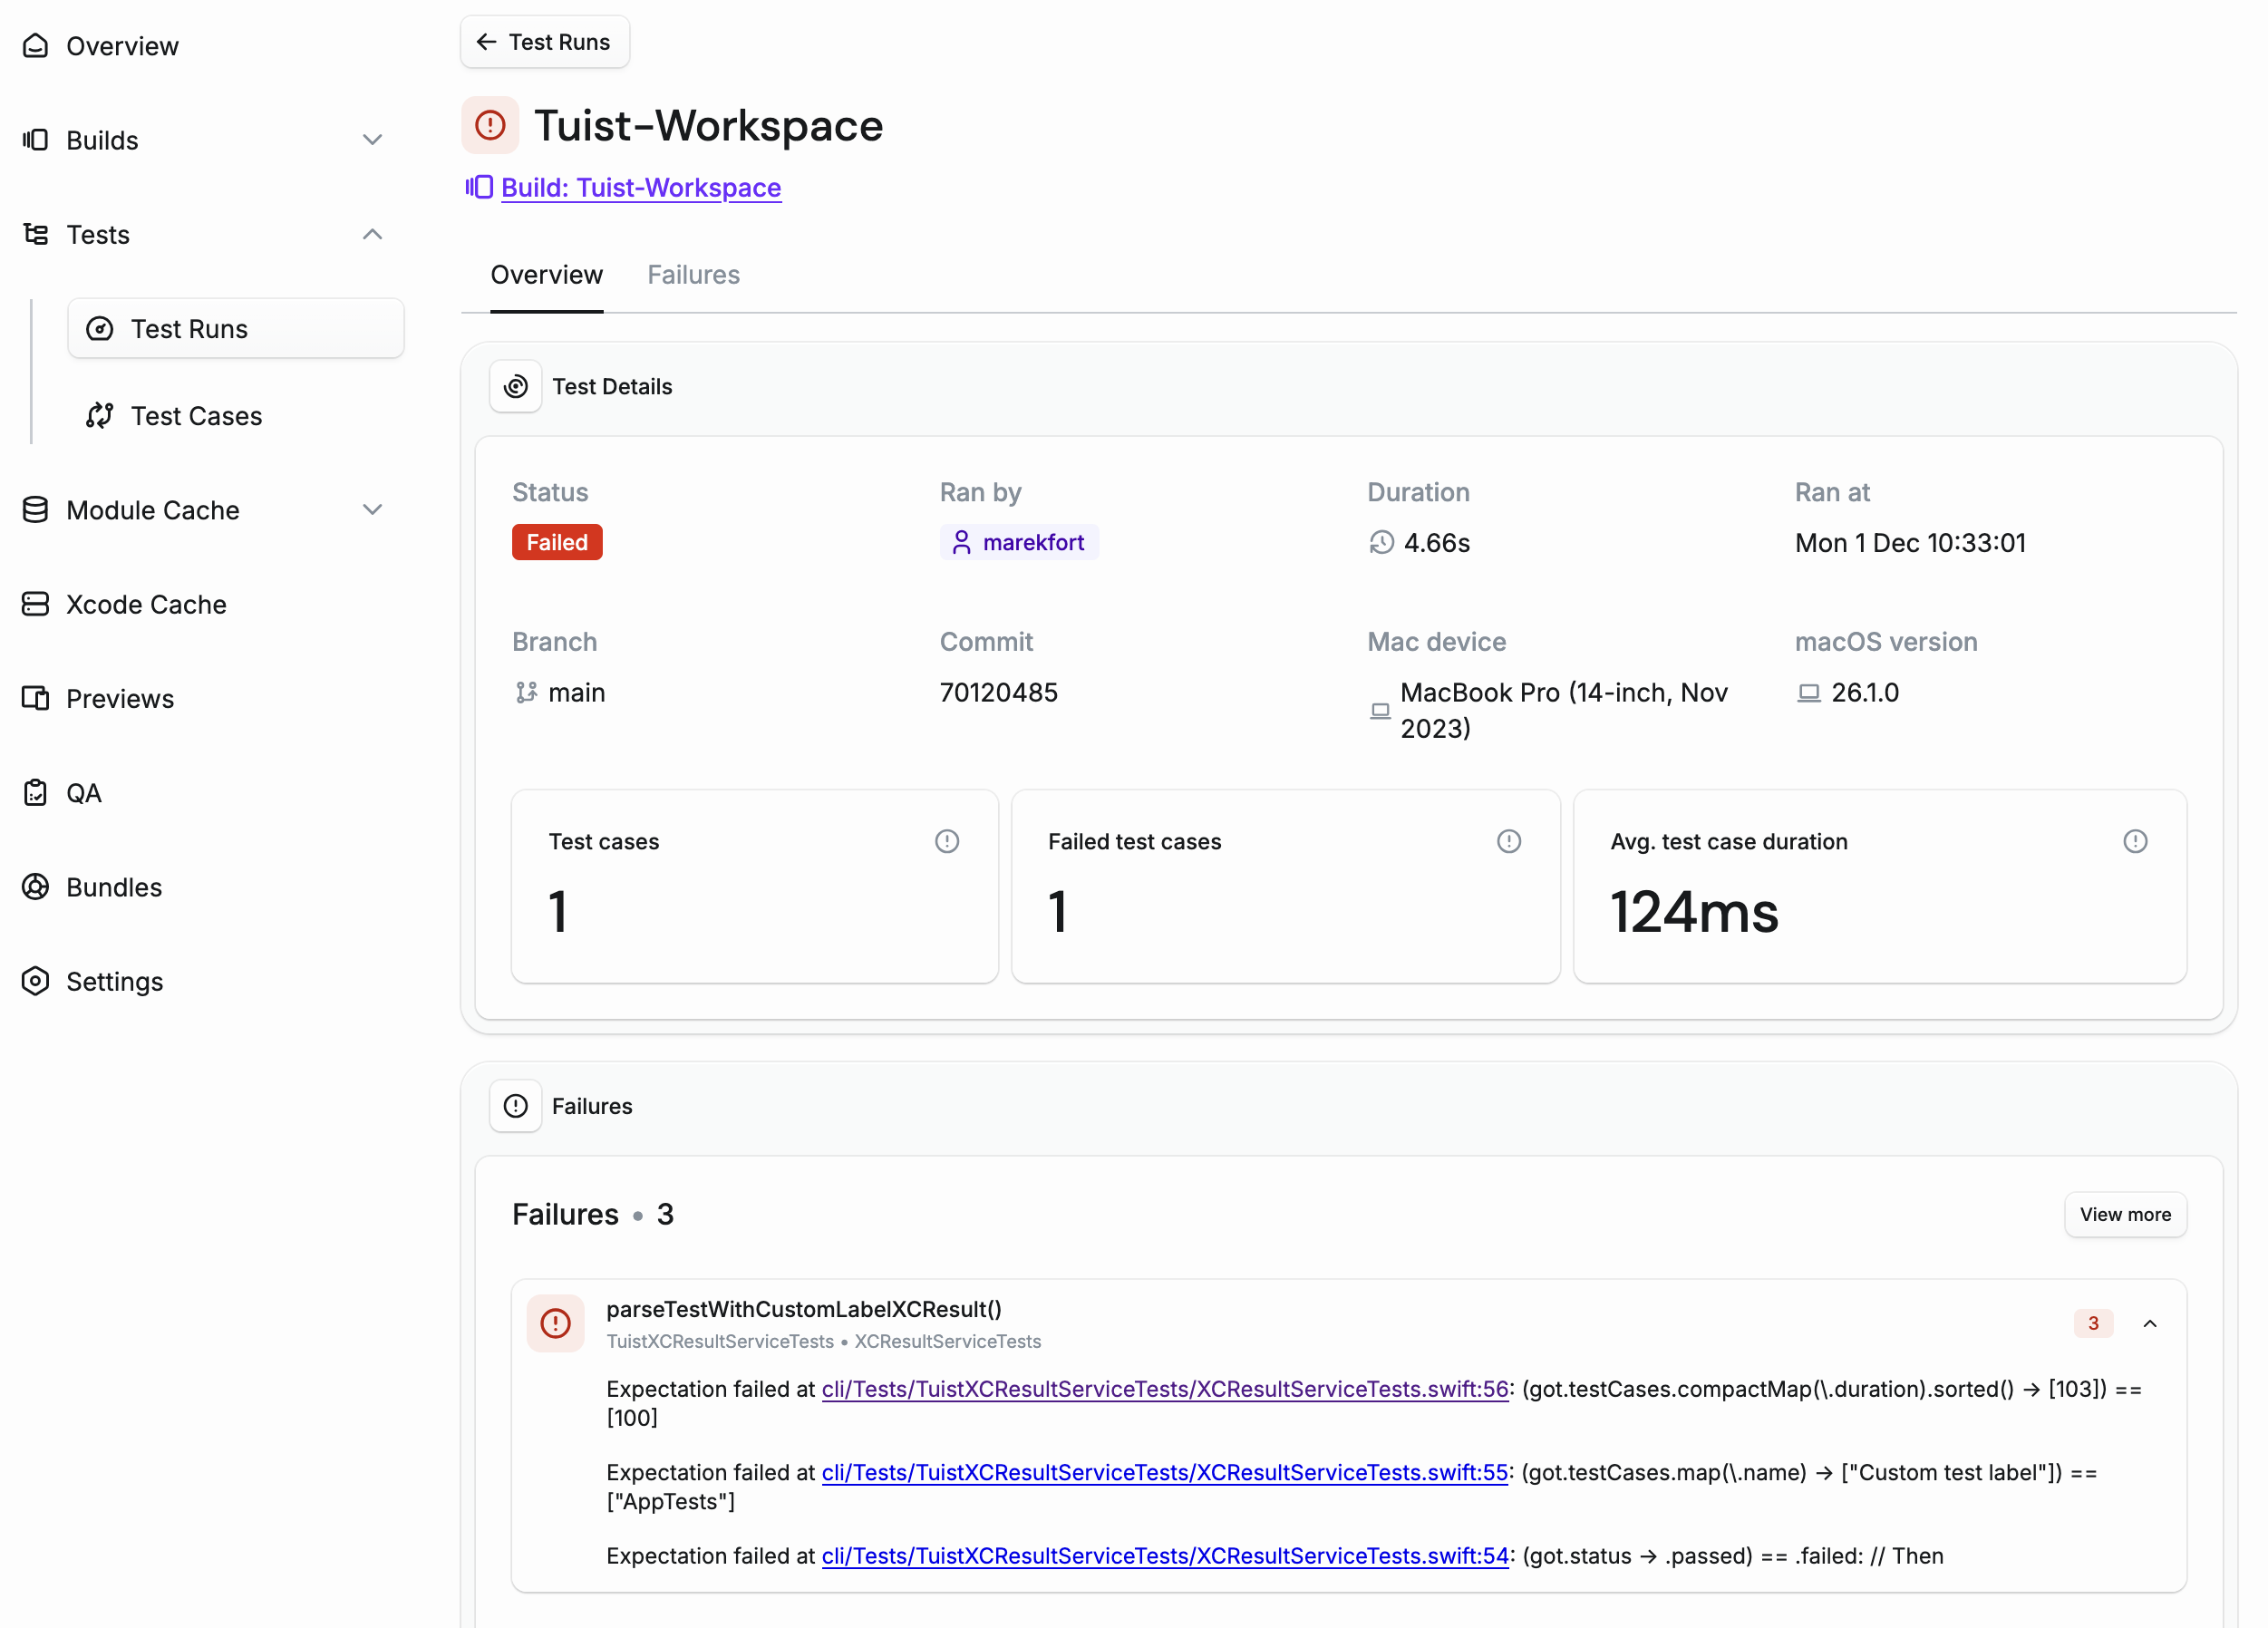
Let's imagine another scenario: your run on the CI was taking longer than expected. But you have no idea why. With test insights, you can now get a breakdown of how long individual test cases, suites, and modules took to run. And you can compare them with the average.
Tests over time
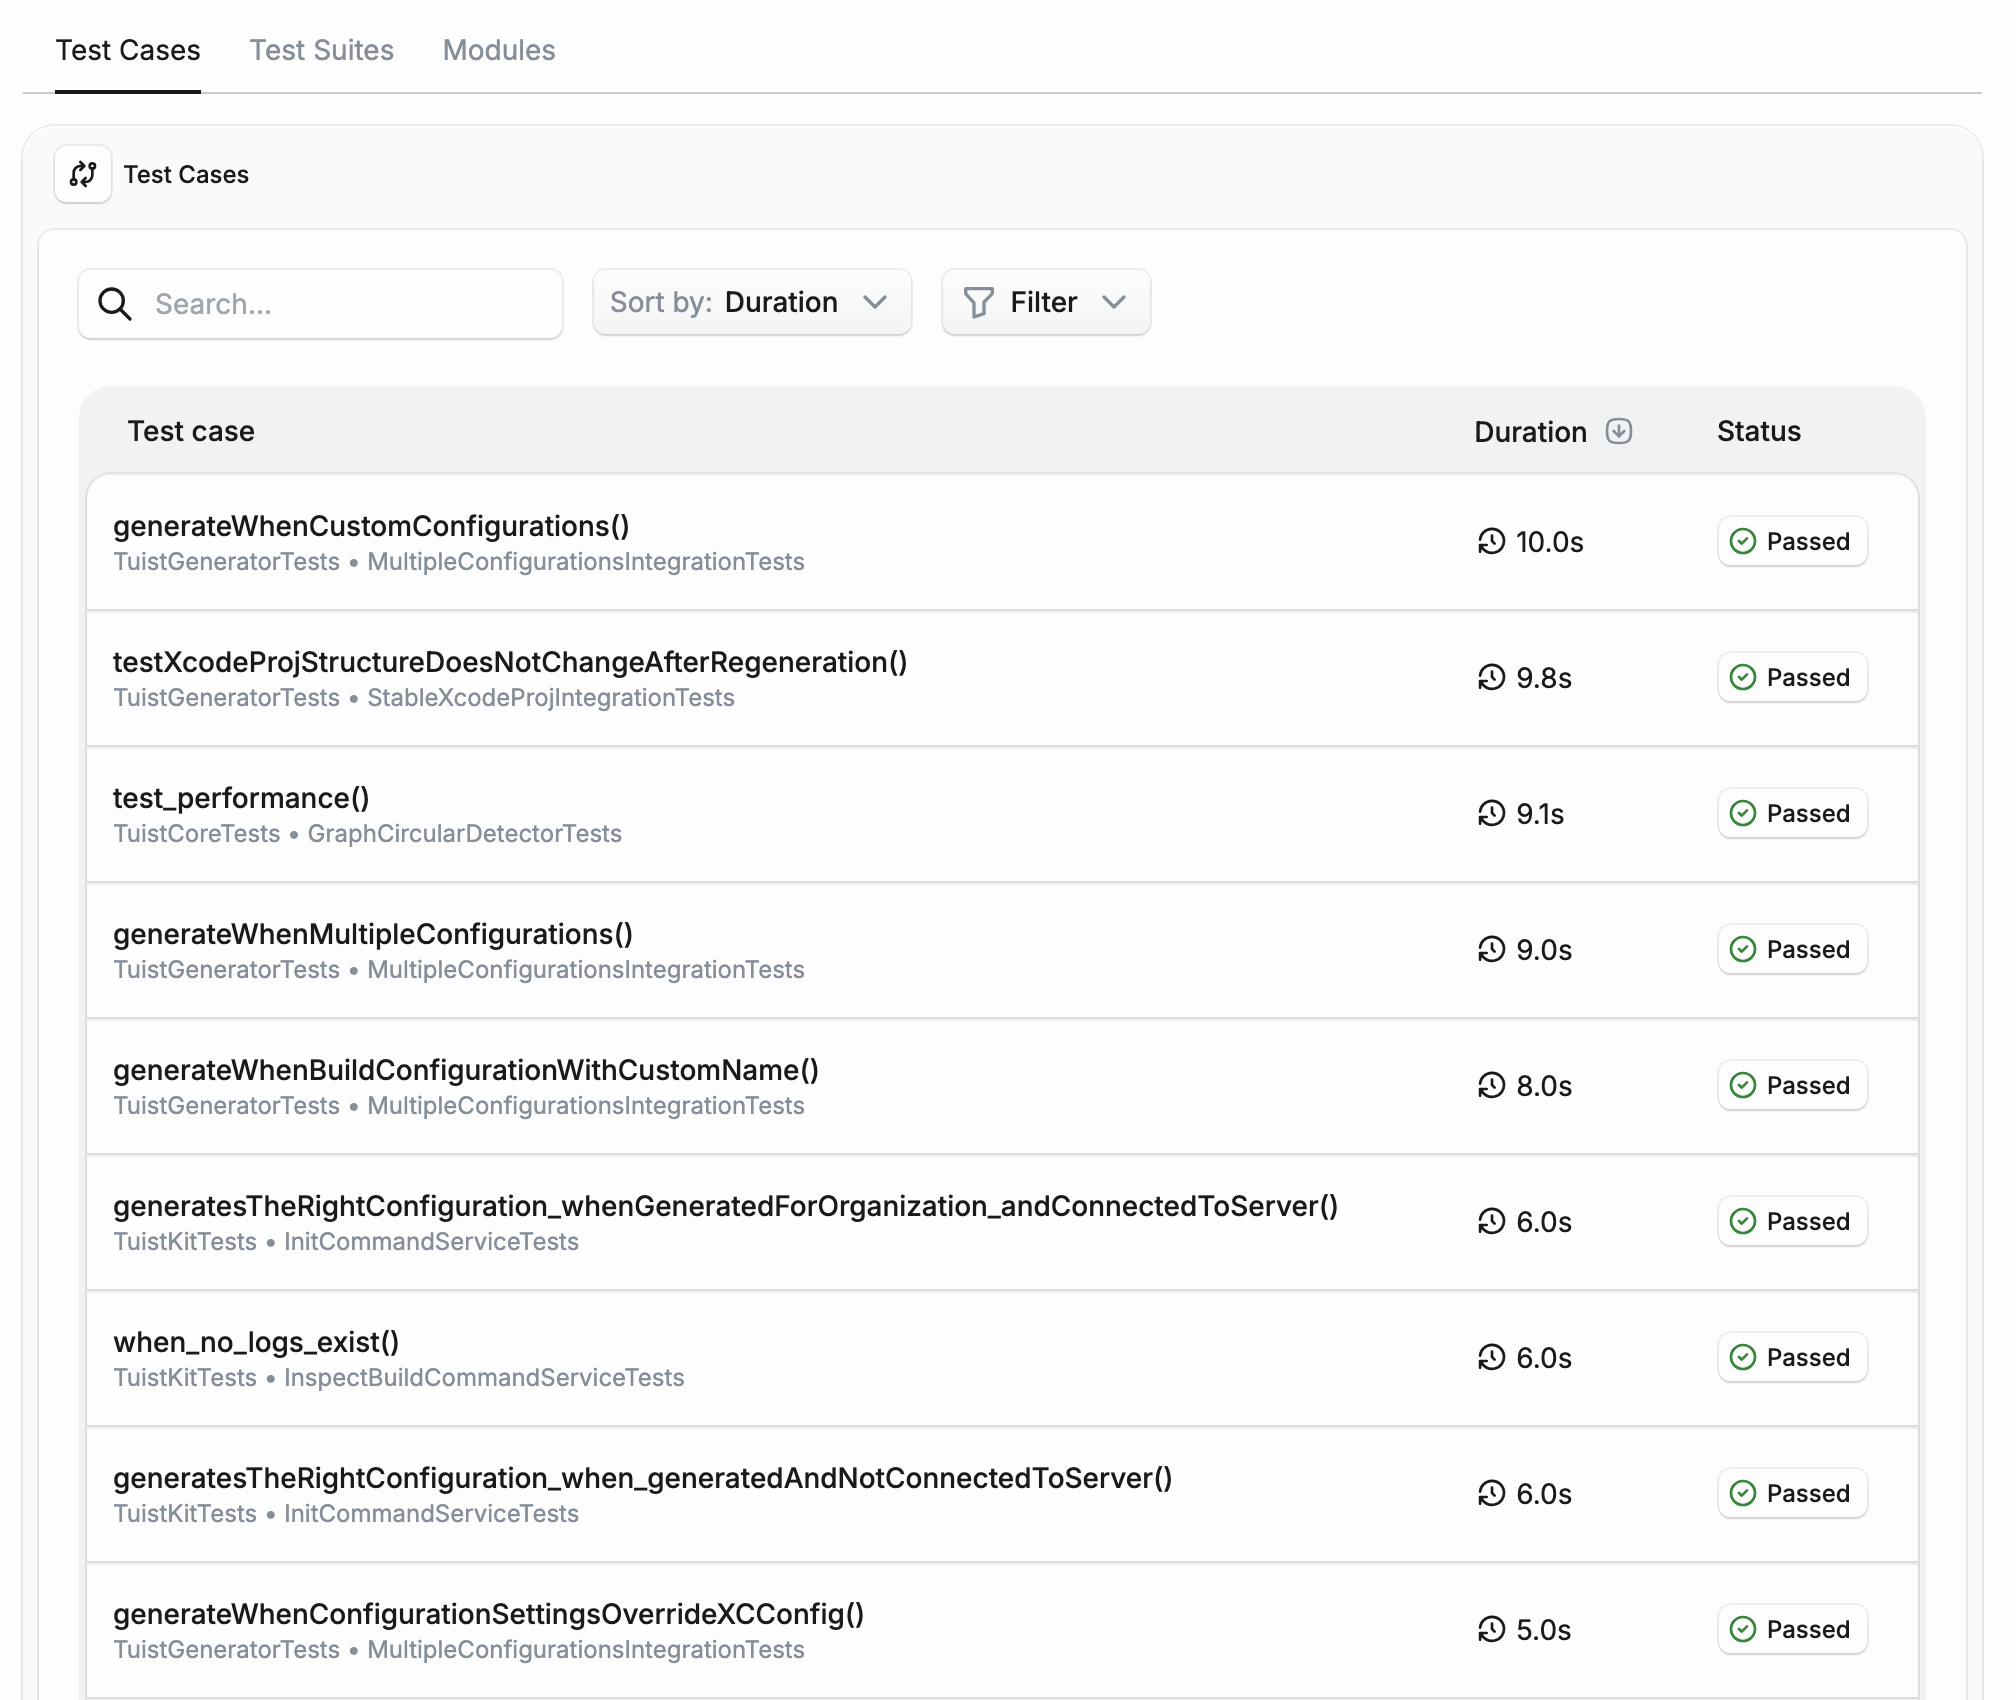
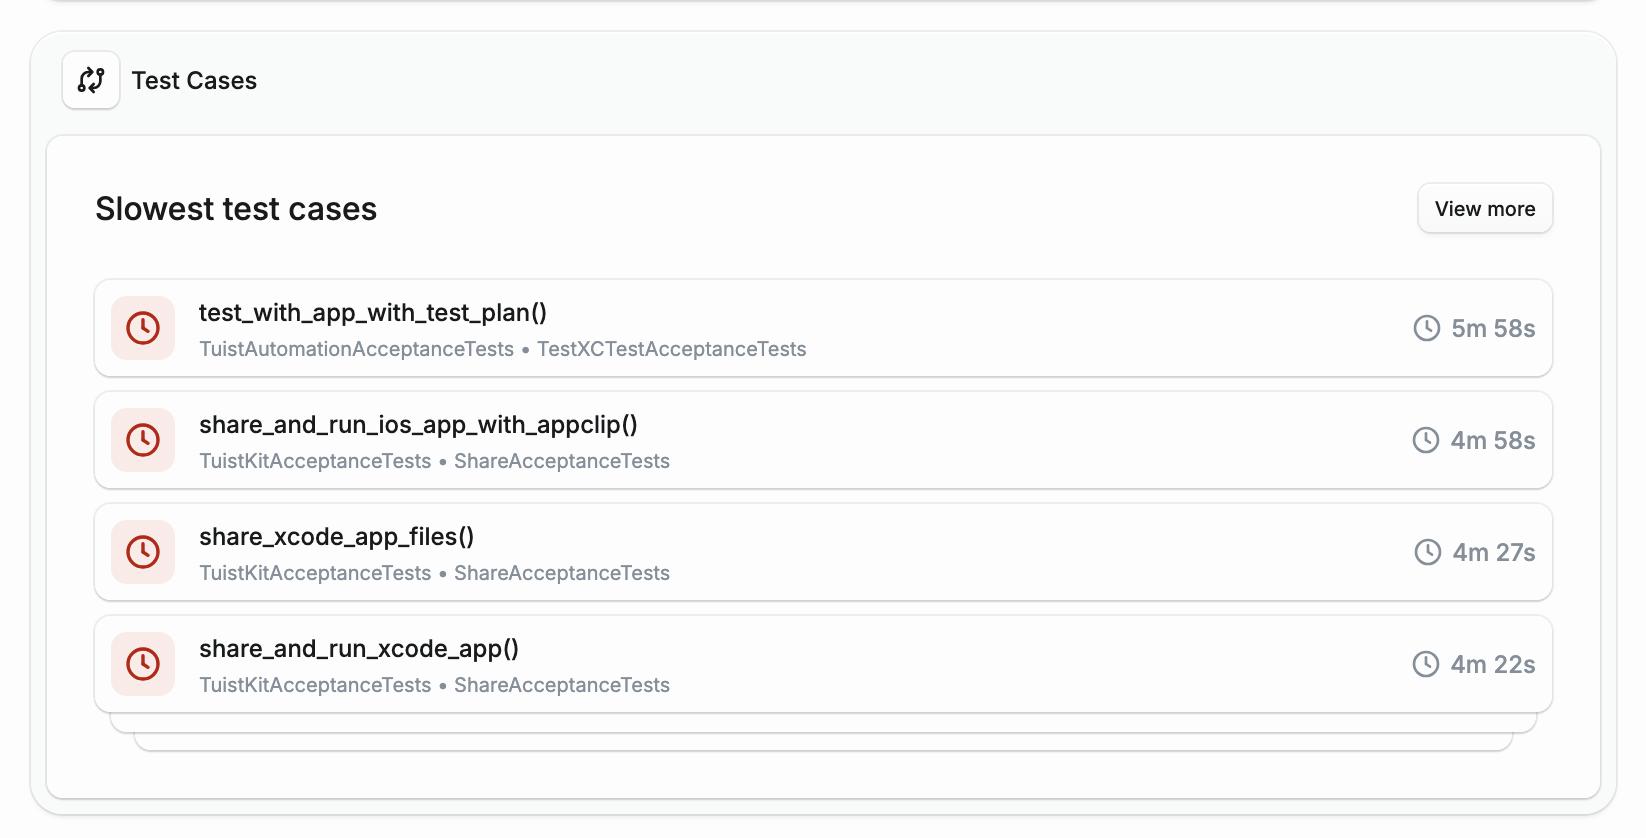
Things start to get really interesting when you start tracking tests over time. Is your test suite slow? We can tell you which of your test cases are the slowest, so you know what to focus on:
Is your test suite getting faster or slower? Has there been a recent regression in the test execution time? The Tuist dashboard provides you with answers to these questions as well:
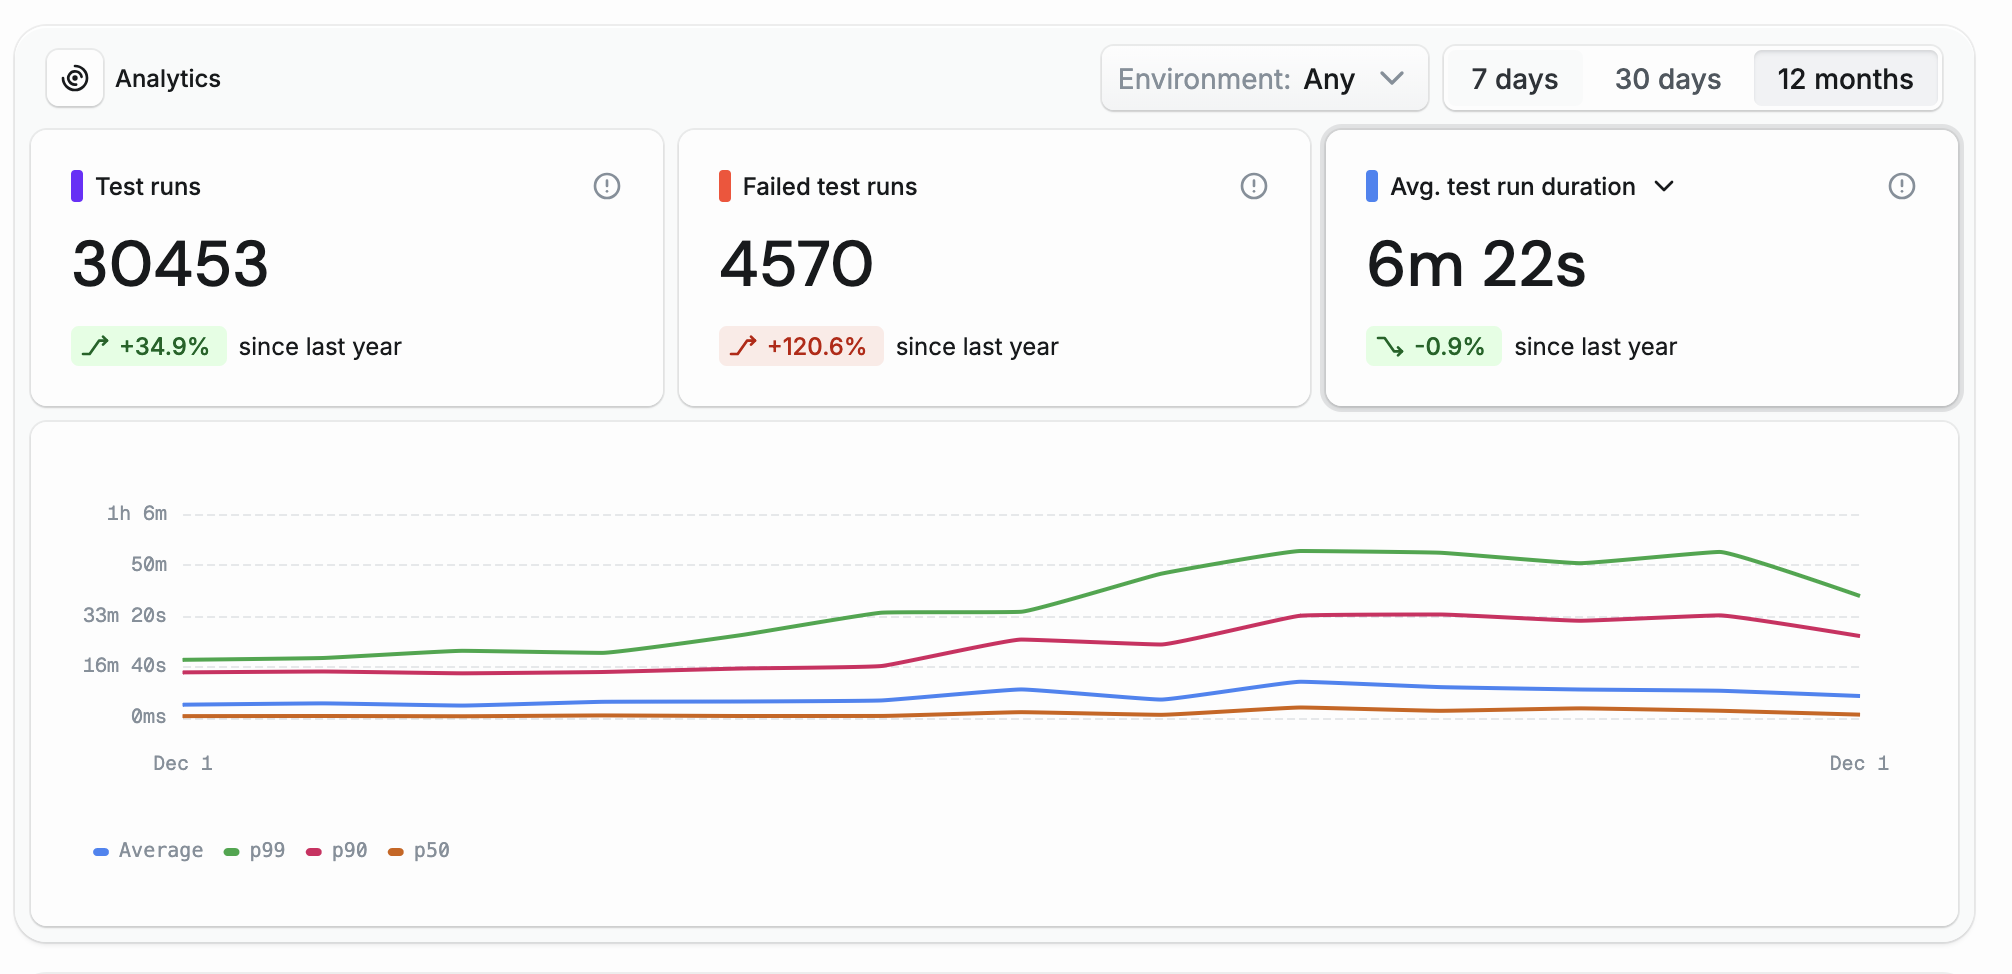
And it bears repeating – the test insights are environment-agnostic, so you can get a holistic view of your test suite's performance across different environments, not just your CI. Additionally, the test insights are CI-agnostic, it doesn't matter which CI provider you're using, you will get the same insights wherever you run your tests.
Do you want to explore the feature on your own? Our Tuist dashboard is open for anyone, including the new test insights.
How test insights work
You might be wondering what happens under the hood when you run tuist inspect test. Here's a quick overview:
- The post-action finds the latest
.xcresultfrom your derived data. The derived data location is determined based on the$SRCROOTenvironment variable that Xcode provides. - We use Apple's
xcresulttoolto get the JSON representation of the.xcresult. This gives us access to the structured test data that Xcode collects. - We extract the most important pieces – duration, test status, failure messages, and more – and send the data to the Tuist server.
- All of this happens in the background, so Xcode can finish the test action without waiting for the upload to complete.
- The server stores the data in ClickHouse, an analytics database optimized for fast queries over large datasets. This allows us to efficiently analyze your test history and surface insights in the dashboard.
Since the full implementation is open-source, you can check it out here.
What's next
Test Insights takes Xcode's test data, makes it readily available in your browser, and analyzes it over time – whether you need to debug a failing test on CI or understand how your test suite's performance is trending.
But this is just the beginning. The test insights will provide us with a great foundation to provide more capable features in the future. We want to be more proactive and leverage the data we track to either optimize your projects or tell you what's wrong – without you having to do the digging. Here are some of the things we will be working on:
- Test flakiness: which of my tests are flaky? Can you skip running them until the flakiness is resolved?
- Sharding: For optimal sharding, it's important for each shard to run for a similar amount of time. We already know how long your tests take on average, so we can use that information to optimize your sharding strategy.
- Slow test alerts: have you added a test that is abnormally slow? Let us tell you!
- Snapshot attachments: if you're using snapshot testing, we'll show you the image differences directly in the test detail
Are there any day-to-day pains related to your test suite? Let us know and we'd love to prioritize solving your needs.
To learn more about test insights, head over to our documentation. If you have any feedback or suggestions, please don't hesitate to reach out to us at [email protected].