Measure, analyze, and improve your build times with Tuist Build Insights
Sooner or later in the lifecycle of any software project, you'll find yourself needing to iterate on its setup and tools to ensure your momentum doesn’t fade. We often refer to this as scaling development. It’s inevitable. The tools and practices that once worked start to break down as the project grows larger, with multiple modules, complex dependencies, a team of contributors working in parallel, and a growing test suite ensuring reliability.
Among all the factors at play, one of the most critical—because it directly affects the feedback loop—is build time. Build performance tends to degrade as projects grow, often due to unreliable incremental builds, derived data resets, or changes in the project graph or toolchain (e.g., explicit modules) that can impact parallelization. Understanding build times is essential for making optimizations and improving development velocity—but doing so is far from straightforward.
While the toolchain provides data—like the build graph—raw output alone isn’t enough. First, you need to make that data accessible. Second, data that’s isolated in time or scope may not reveal much. But if you persist it over time and correlate it with the team activity—tying it back to specific developers or workflows—then meaningful insights start to emerge.
At Tuist, we don’t want to just help teams optimize workflows through better tooling; we also want to empower them with actionable data to make smarter decisions—whether to boost productivity or improve developer happiness.
That’s why we’re thrilled to introduce Tuist Build Insights: Xcode build analytics for collecting and analyzing build data across any environment—including local development.
👉 If you’d like to see it in action, check out the video below:
Integration
To get started with build insights, you will need a Tuist account and a project. The best way to get started is to use our CLI and run the tuist init command.
Once you authenticate, you will need to add a tuist inspect build command in your Xcode scheme build post-action – unless you use generated projects, in which case we generate the post-action for you:
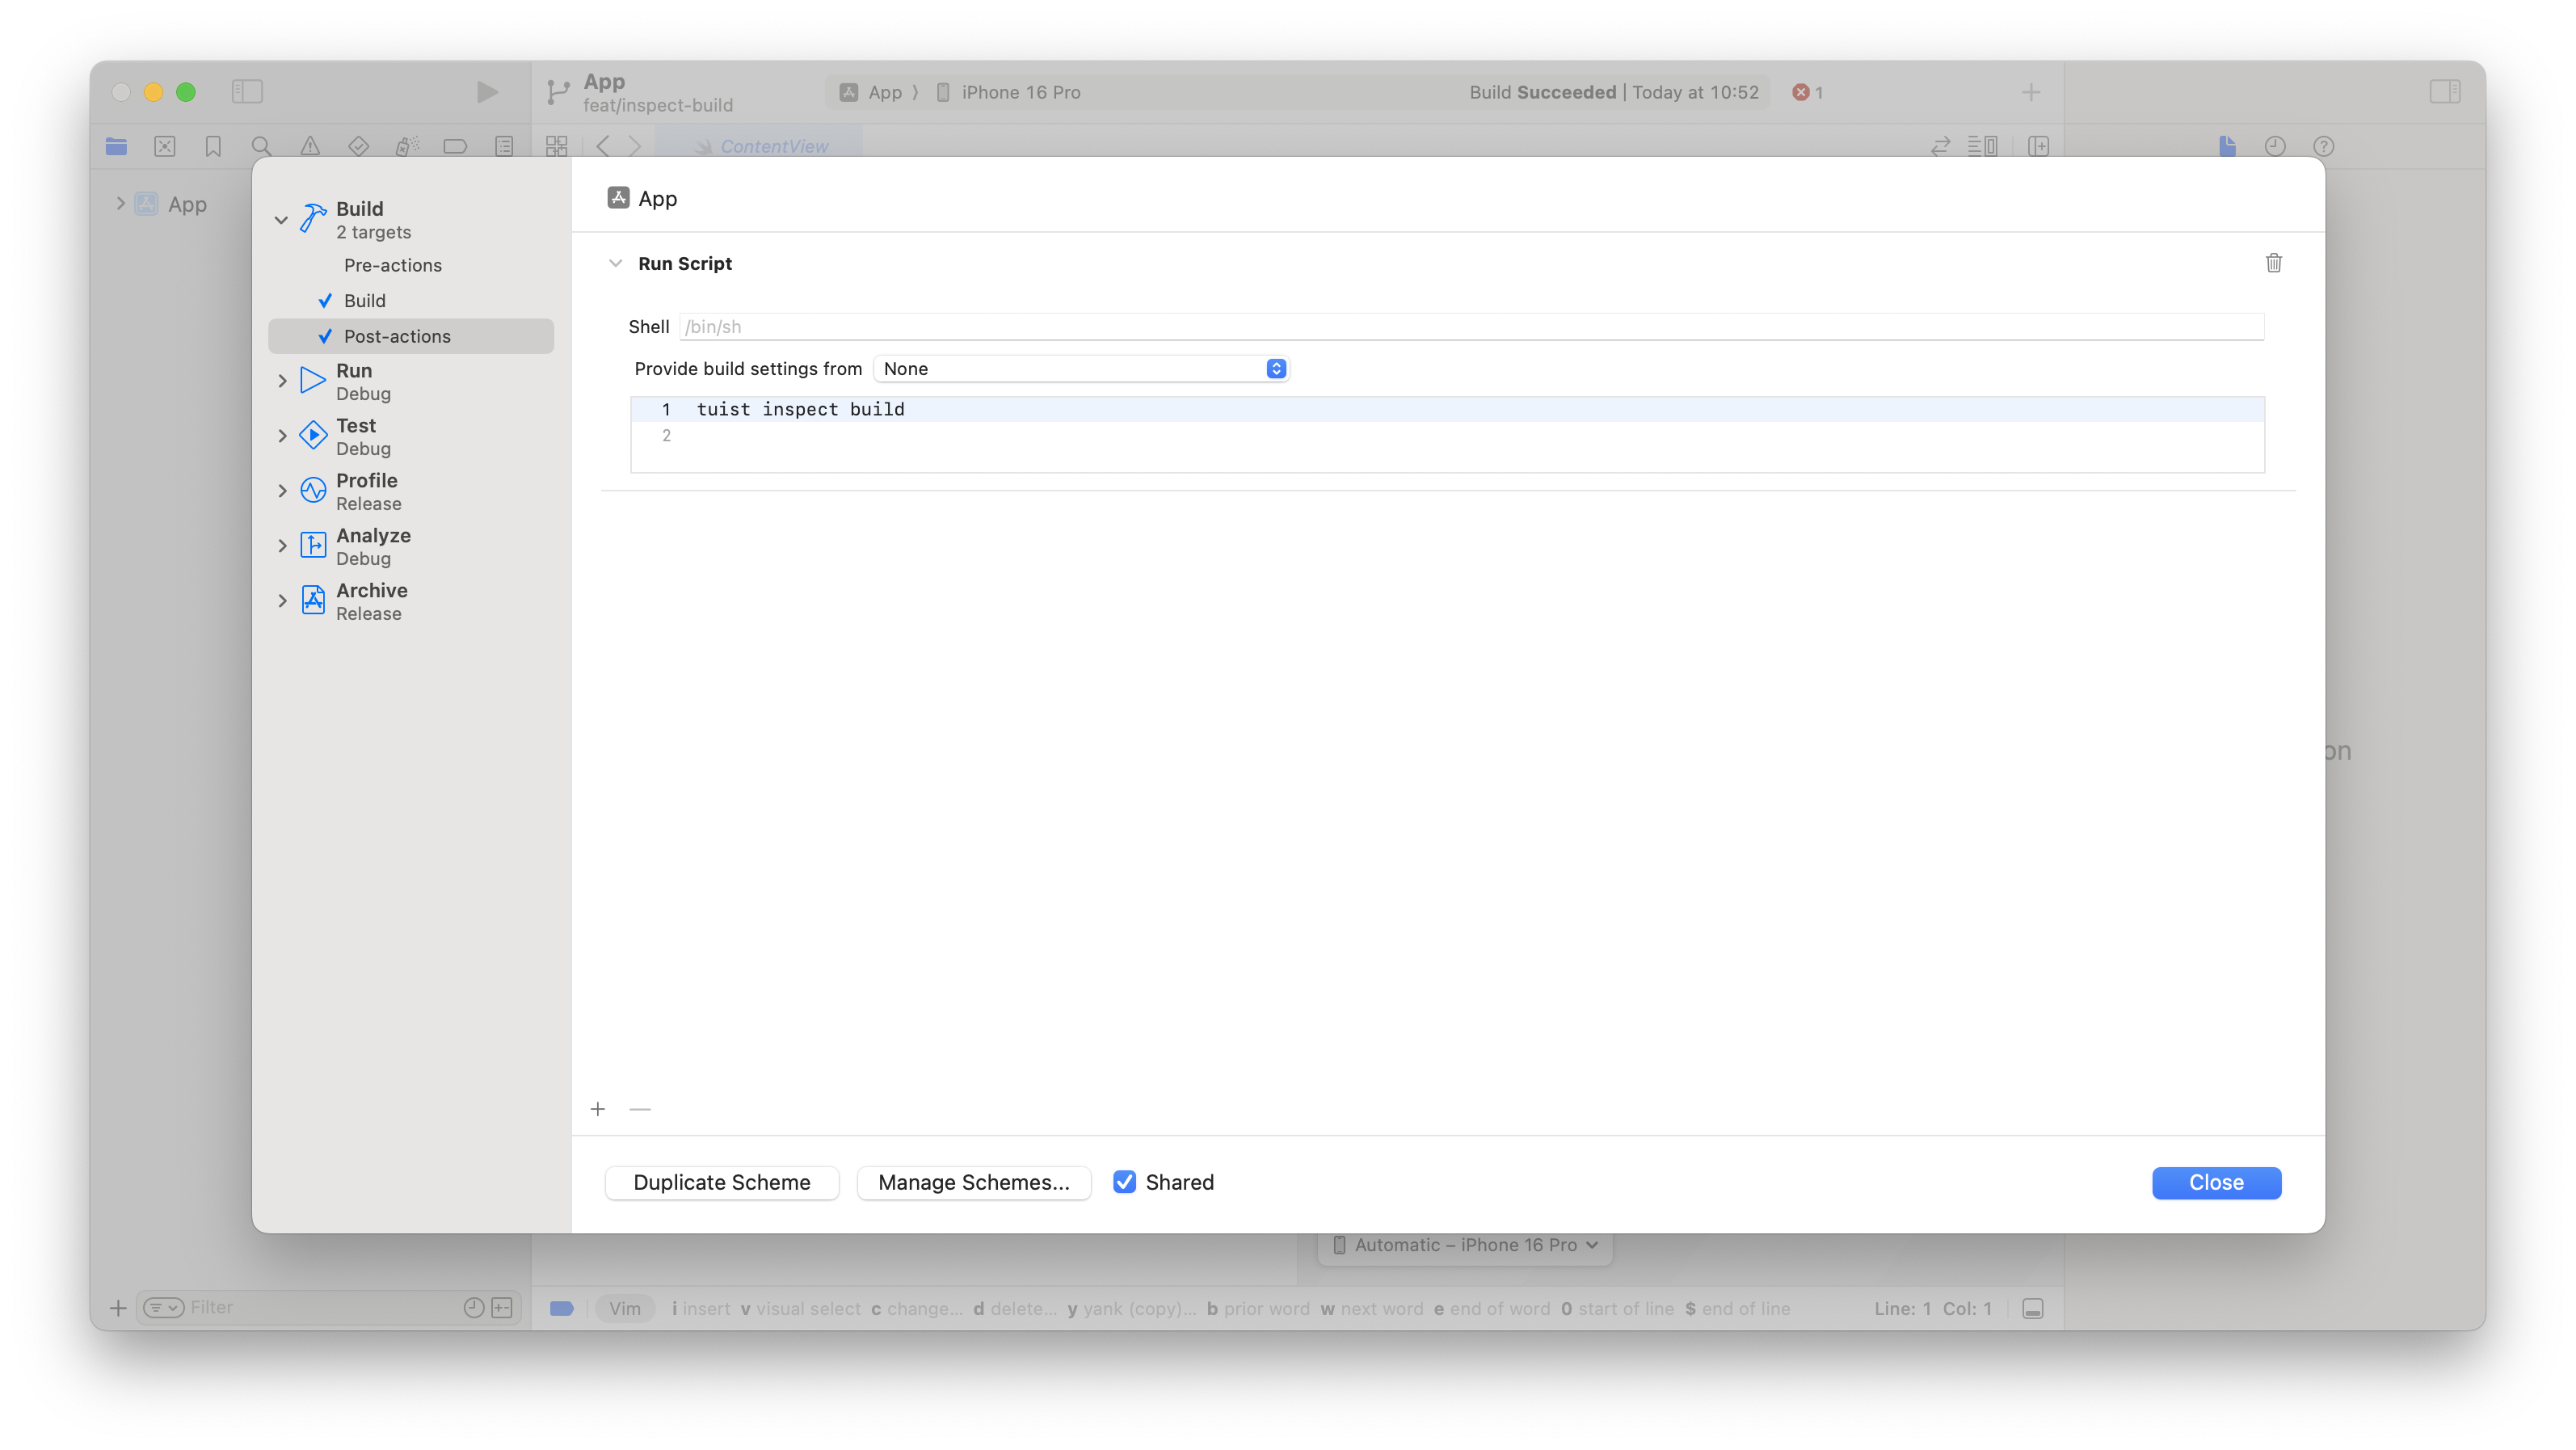
For more details how to set up build insights, head over to our docs.
Inspecting individual builds
After you include tuist inspect build in your Xcode build post-action, build your app in Xcode and once the build is finished, you will see the build directly in your project dashboard.
When you go to a given build detail, you will see something like this:
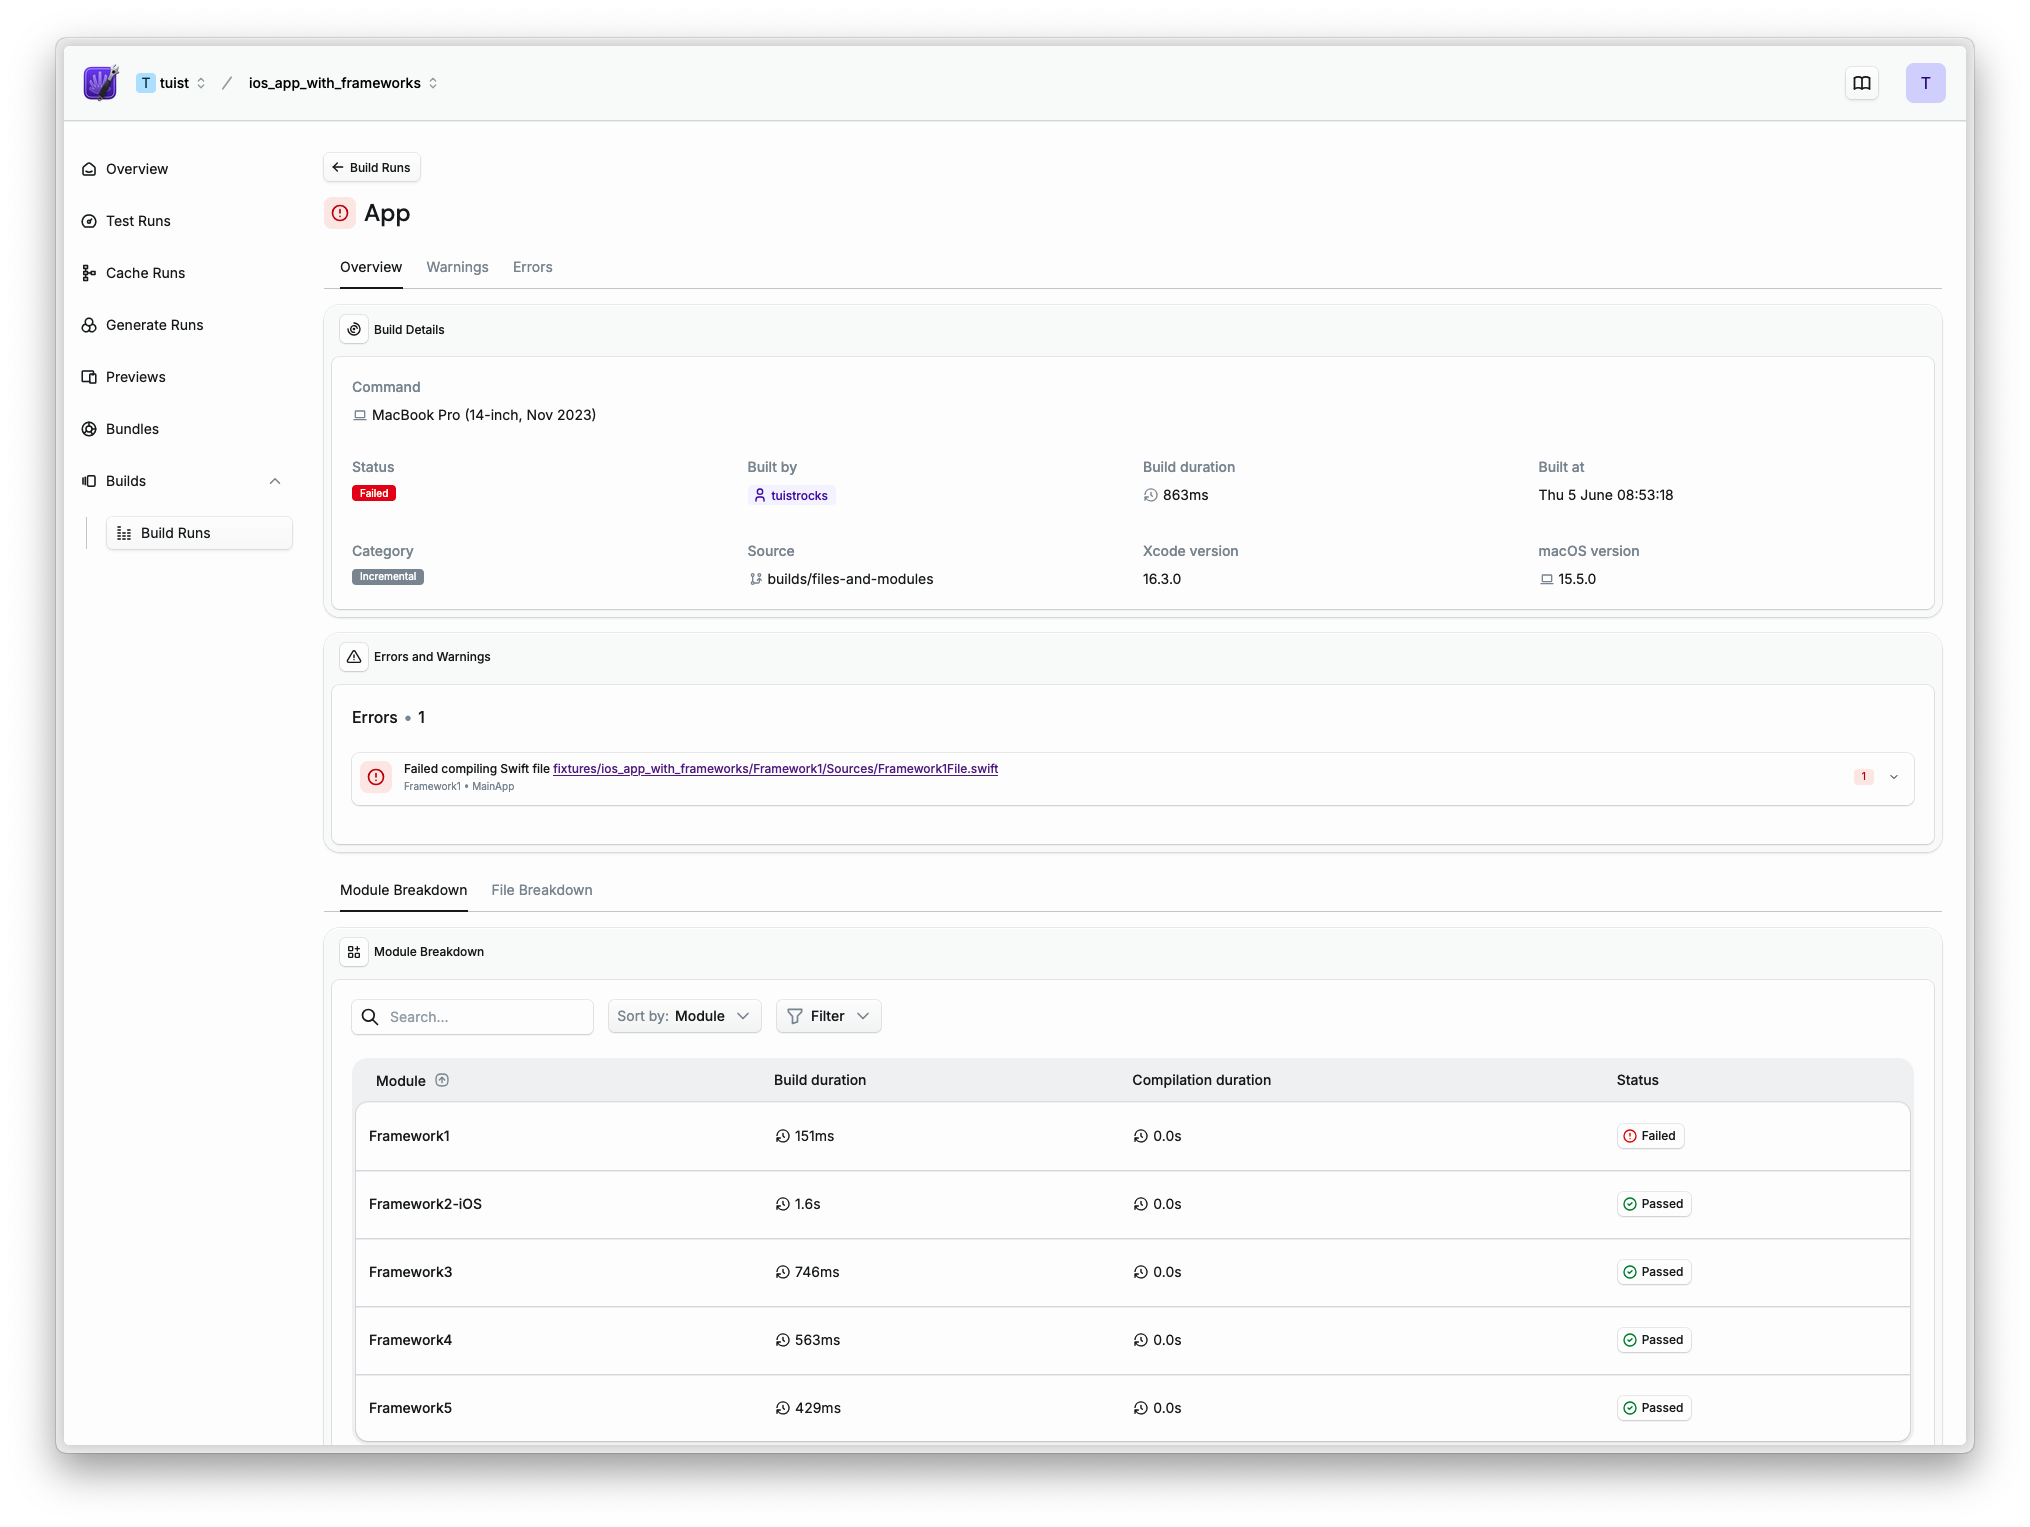
Let's break down what's included in the build detail:
- Metadata such as git branch, whether a build was clean or incremental, build duration, Xcode version, and more.
- Errors and warnings: Listed errors and warnings flagged during the build. You get a readable message along with a link directly to the source file in GitHub. No need to parse the obscure
xcodebuildoutput anymore from your CI logs. - Module and file breakdown: Ran into a long build? Tuist now lists out how long Xcode took to build individual modules and files, so you can focus on the outliers.
The build detail comes especially handy when you need to inspect a build that occurred in a different environment than yours – such as from the CI – or when analyzing build performance of a particular build. No need to upload and download .xcresult bundles anymore. What's more, you can easily send a link to your colleagues, so they can inspect the build themselves.
However, build insights are not limited to inspecting individual builds. Where this feature really shines is when the data is analyzed over time. Something you can't get with Xcode.
Tracking builds
Especially in larger organizations, having the data to assess the health of the developer environment is crucial to ensure developers are not hindered by slow builds. While organizations usually track the duration of CI pipelines, they often lack insights into the local developer environment. And on the CI, the numbers can be often misleading since the measurements are usually bundled with the rest of the pipeline.
Tuist helps you to answer questions such as:
- How often do engineers run clean builds?
- How long does it typically take to build the app on incremental builds?
- How does the build time vary between different Xcode versions and devices?
All of these questions, you will be able to answer by going to the "Builds" page in the Tuist dashboard:

In the "Builds" page, you have access to filters filters such as:
- Scheme
- Build – incremental or clean
- Environment – local or CI
You can use these filters to powerfully slice the data, like getting the number of local clean builds that occurred in the last 30 days, along with the average build time.
Do you want to play with an actual dashboard? Our Tuist dashboard is open for anyone, so you can see the build analytics that we track when working on the Tuist CLI and the upcoming iOS app: https://tuist.dev/tuist/tuist/builds
Wrapping up
Tuist build insights is a powerful tool to take Xcode's data, make it readily available in your browser, and analyze the data over time to simplify inspecting individual builds in arbitrary environments and to understand how productive your developer environment.
How are we going to improve build insights further?
We will:
- Include a link to builds from your CI workflow in the GitHub Tuist report
- Add deeper analytics to help you surface areas of improvement, such as adding suggestions for which module to split to optimize the parallelization of your build
- Couple the build data with binary cache optimizations
Sounds exciting? Take this feature for a spin and let us know your feedback or ideas for how to improve build insights further 💜