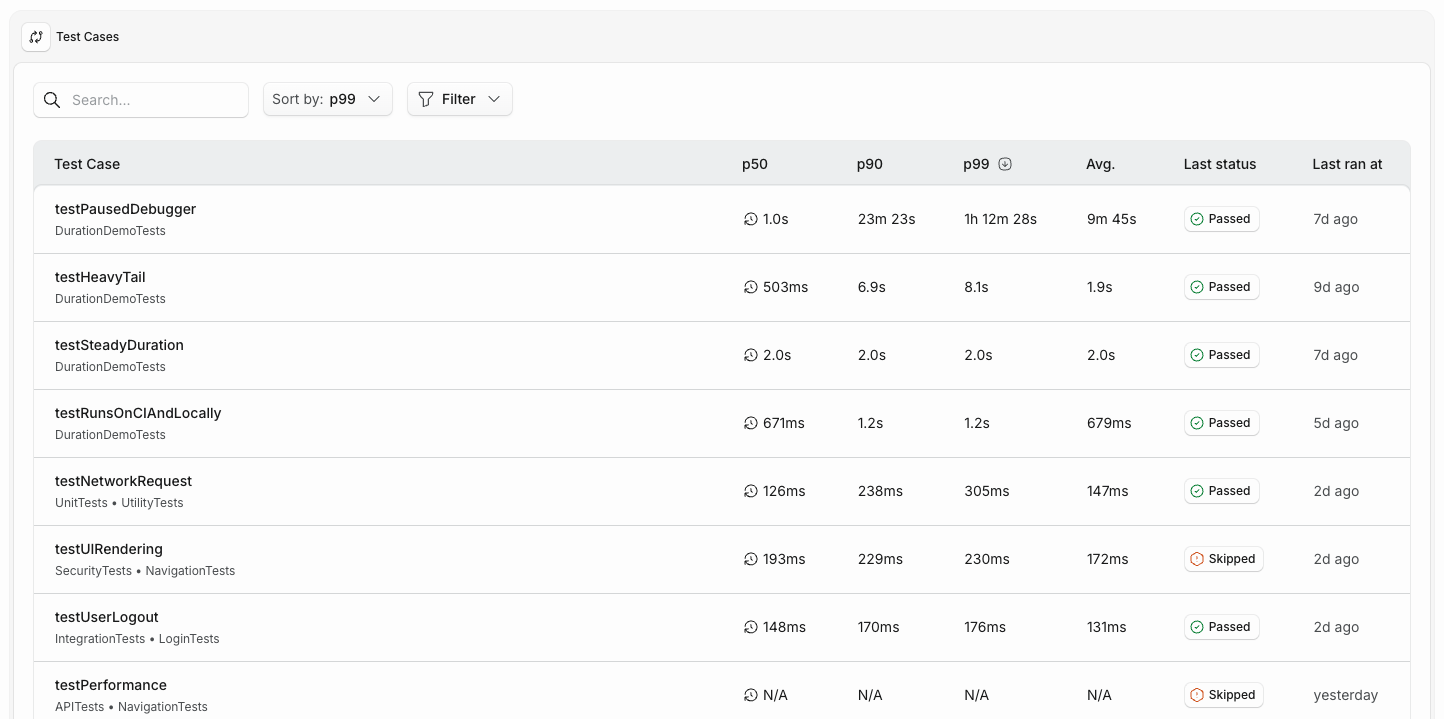
The Test Cases table showed one duration per test: the mean of its last 50 runs, with no time bound and no separation between CI and local. A single stalled run, a paused debugger for example, stayed in that average until 50 newer runs pushed it out, and could put a test that usually finishes in a second at the top of your slowest list.
It now shows p50, p90, p99 and the average side by side, over the runs from the last 14 days and scoped to the environment you select. Reading them together tells you something no single number does: a test whose p50 and p99 match takes the same time every run, while one whose p99 towers over its p50 is usually fast and occasionally not. Each column sorts on its own statistic, so "slowest by median" and "worst tail" are two orderings of the same table.
A test case needs at least five runs inside the window before its durations are ranked. Below that the cells read N/A, so a test with a single recorded run no longer sorts to the top on that one sample.
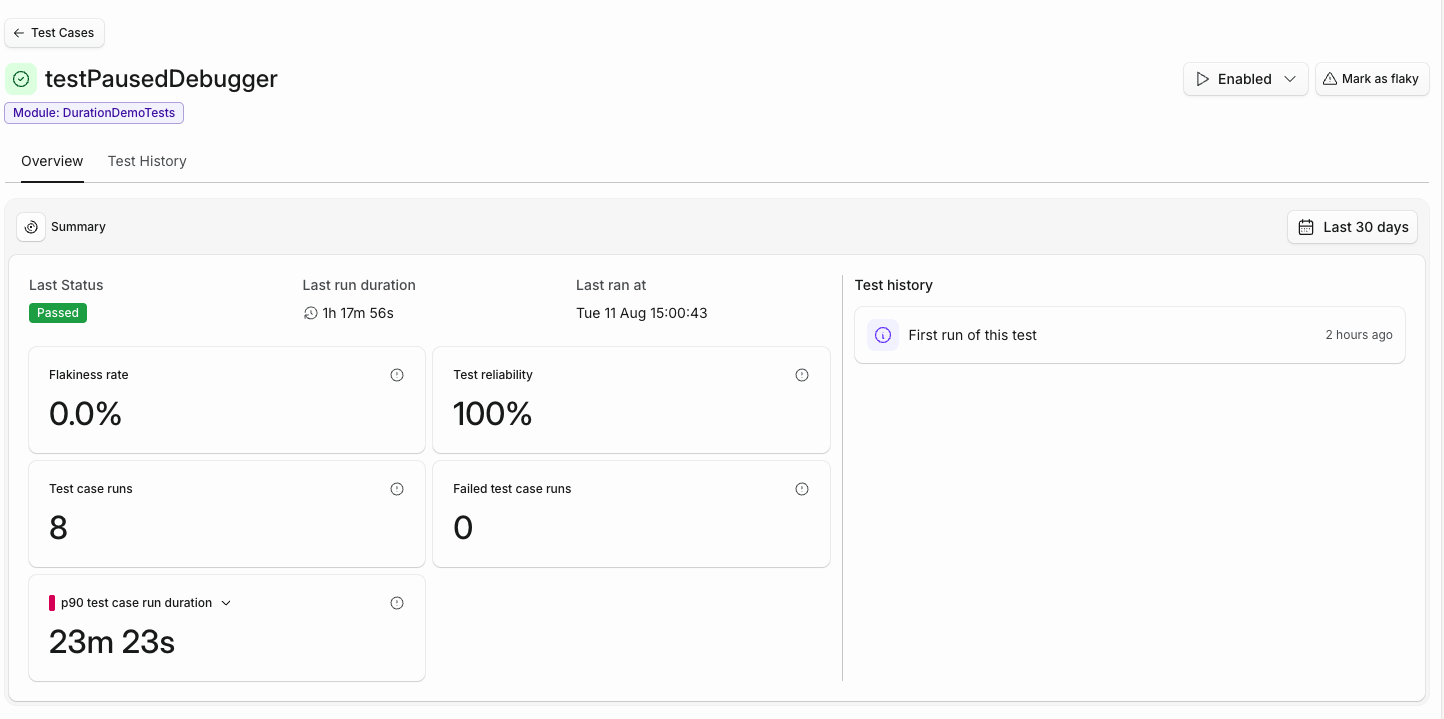
The same statistics are on the test case page, where the duration summary has a dropdown to switch between them.