As your app evolves, its size inevitably increases. New features, additional assets, and expanding codebases all contribute to larger bundle sizes. Tuist Bundle Analysis gives you visibility into what's growing and why. Without proper visibility, it's easy to inadvertently bloat your app with:
- Duplicate assets across bundles
- Unused binary symbols
- Unoptimized resources
- Legacy code and dependencies
A bloated app size doesn't just consume storage—it creates real business impact. Large apps face:
- Higher abandonment rates: When storage on a user's device is low, apps taking a lot of storage are the first ones to go.
- Lower conversion rates: Especially when downloading an app on cellular, a large download size can put away users.
- Exclusion of users: Large apps disproportionately affect users with storage limitations or bandwidth constraints.
For developers in markets where mobile data is expensive or connections unreliable, an unnecessarily large app can effectively lock out potential users.
Today, we're excited to announce a new Tuist feature that helps you keep your app's memory footprint small even as your app grows: Tuist Bundle Analysis.
See the feature in action 👇
Analyze your bundle
To analyze your bundle, use the new tuist inspect bundle command:
tuist inspect bundle App.ipa
This command works with .ipa, .xcarchive, or .app files. After the bundle is analyzed, you'll receive a link to a comprehensive visual breakdown of your bundle:
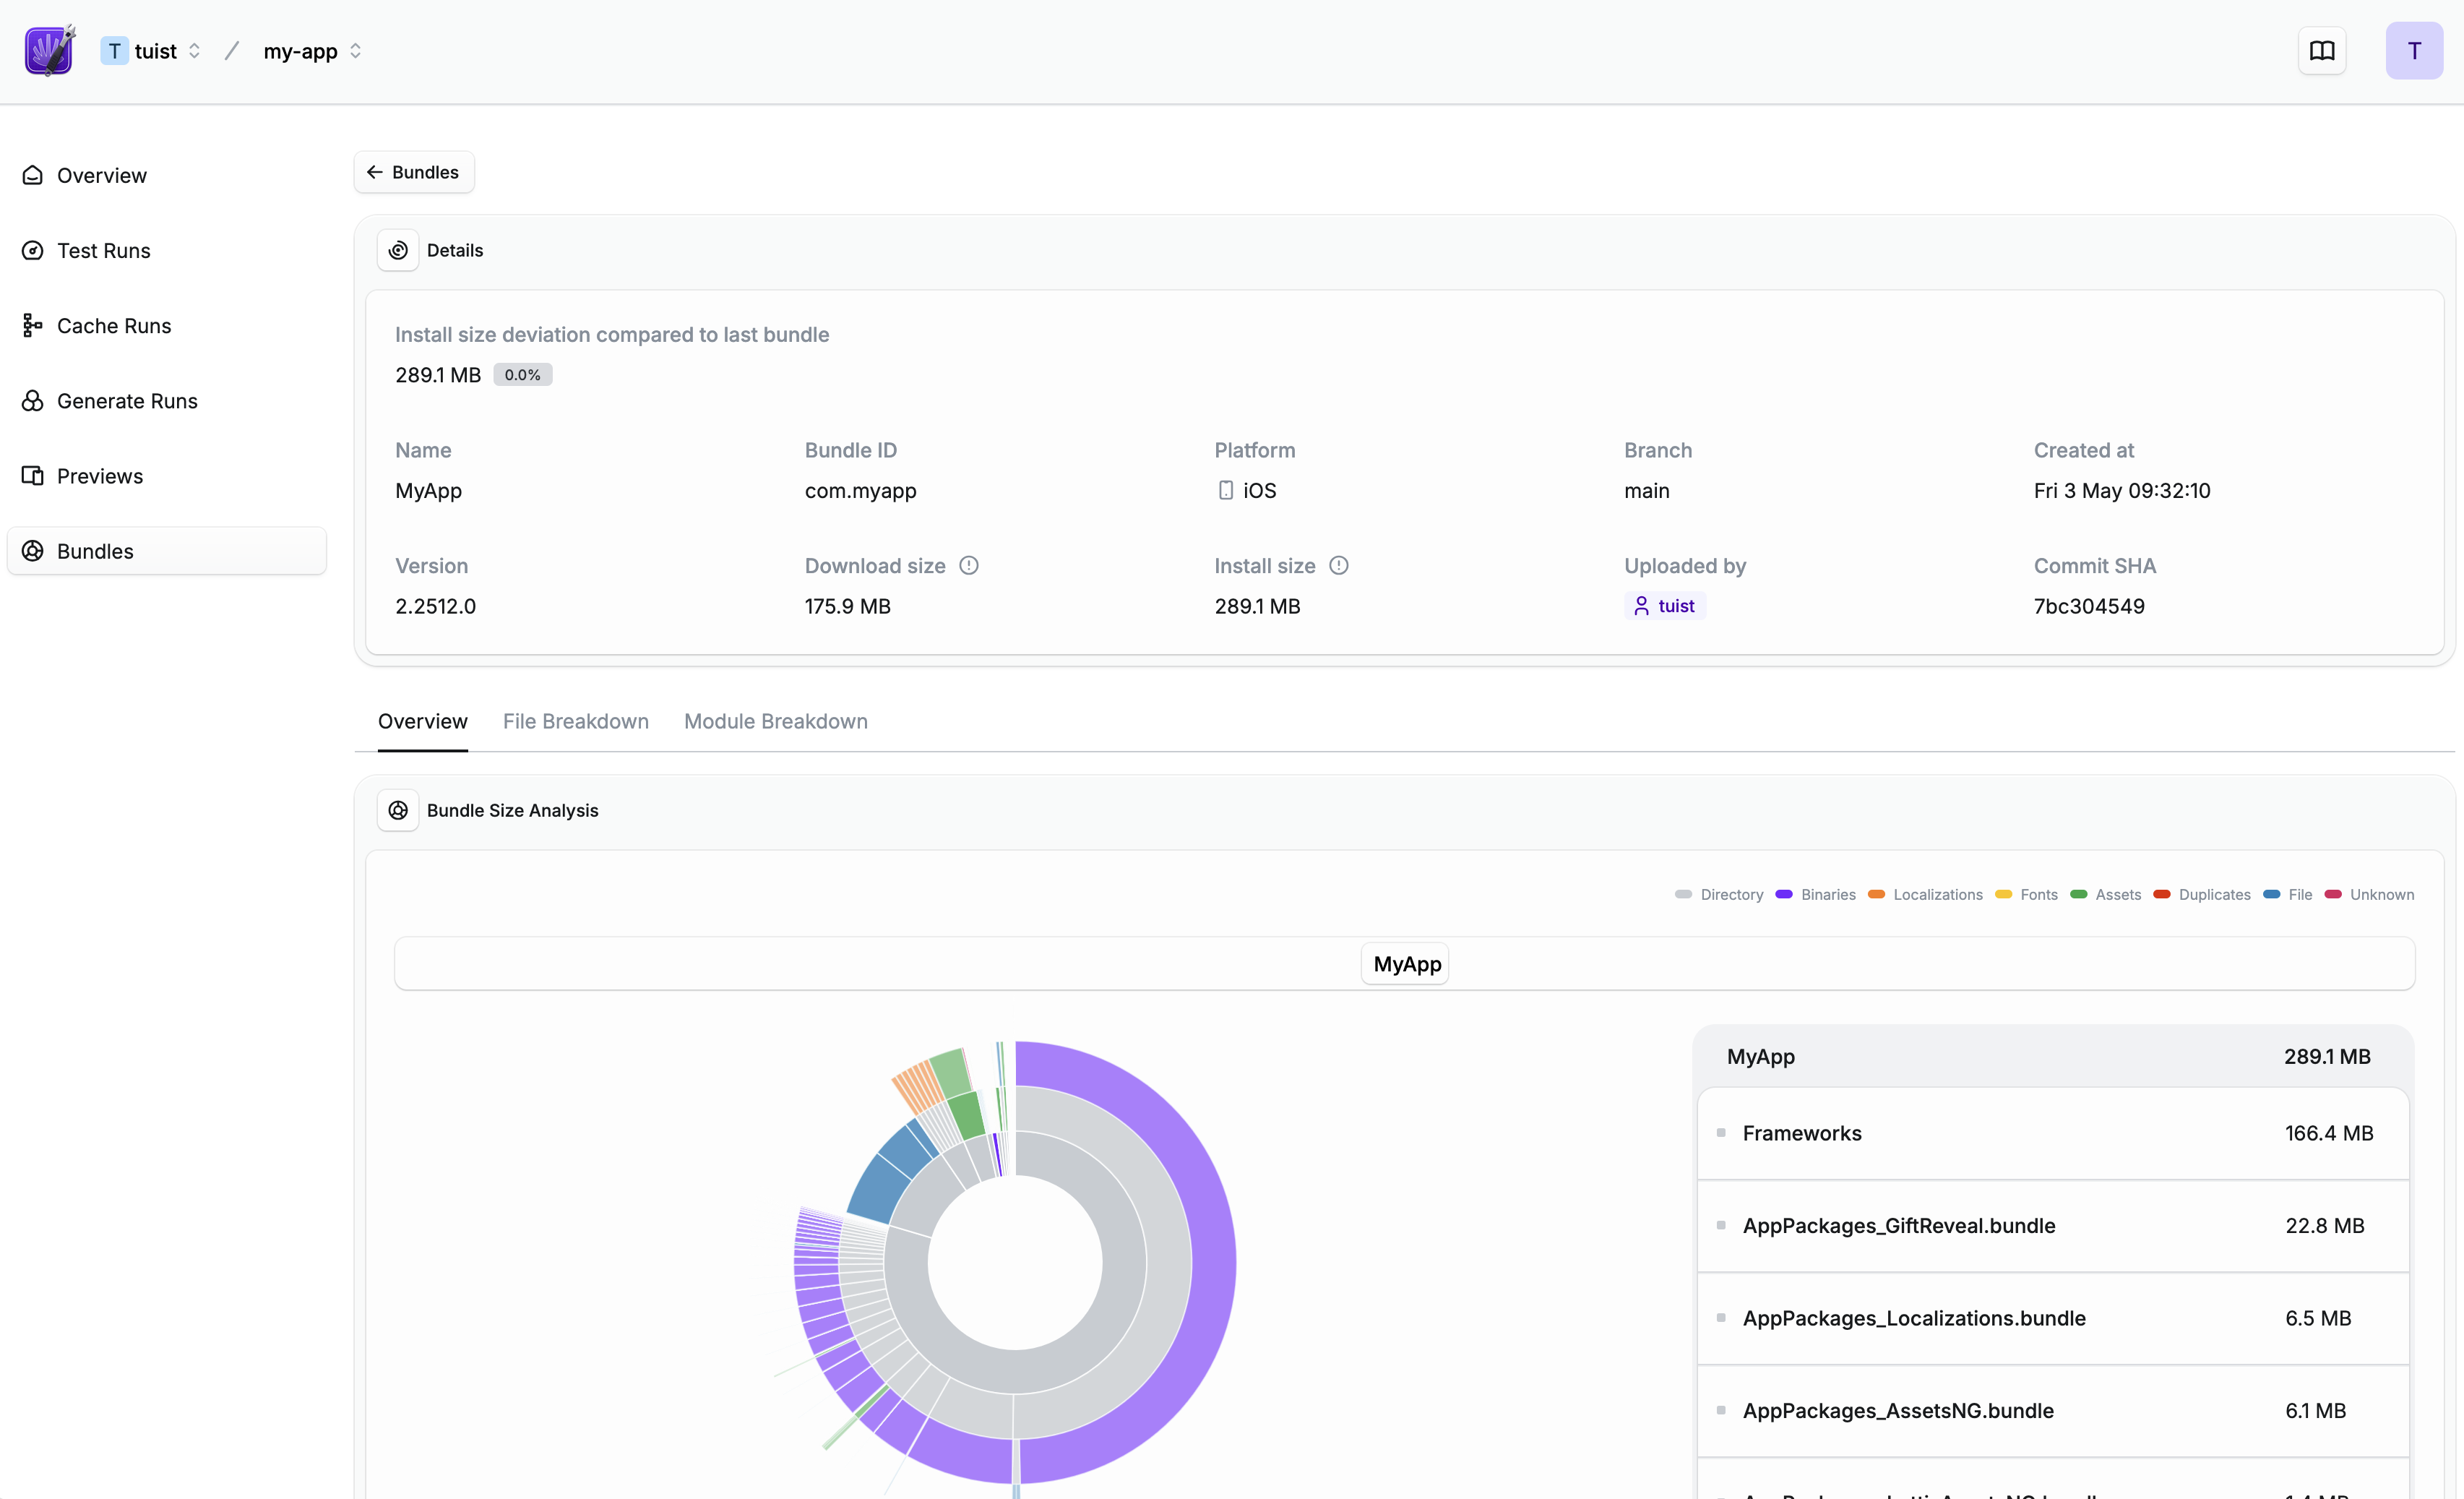
The interactive visualization, file breakdown, and module breakdown help you dive deep into your bundle, making it easier to identify possible areas of improvement.
Tracking bundle size on the CI
How do you know when your bundle size is growing too large? By integrating bundle analysis into your CI pipeline, you can monitor how your app's footprint evolves with each build. You can set up a CI workflow to automate this process and analyze a bundle on each PR. We automatically collect Git and other metadata to make it easier to find specific bundles directly in the Tuist dashboard.
Once integrated, you'll have access to historical size data visualized in clear, actionable charts:
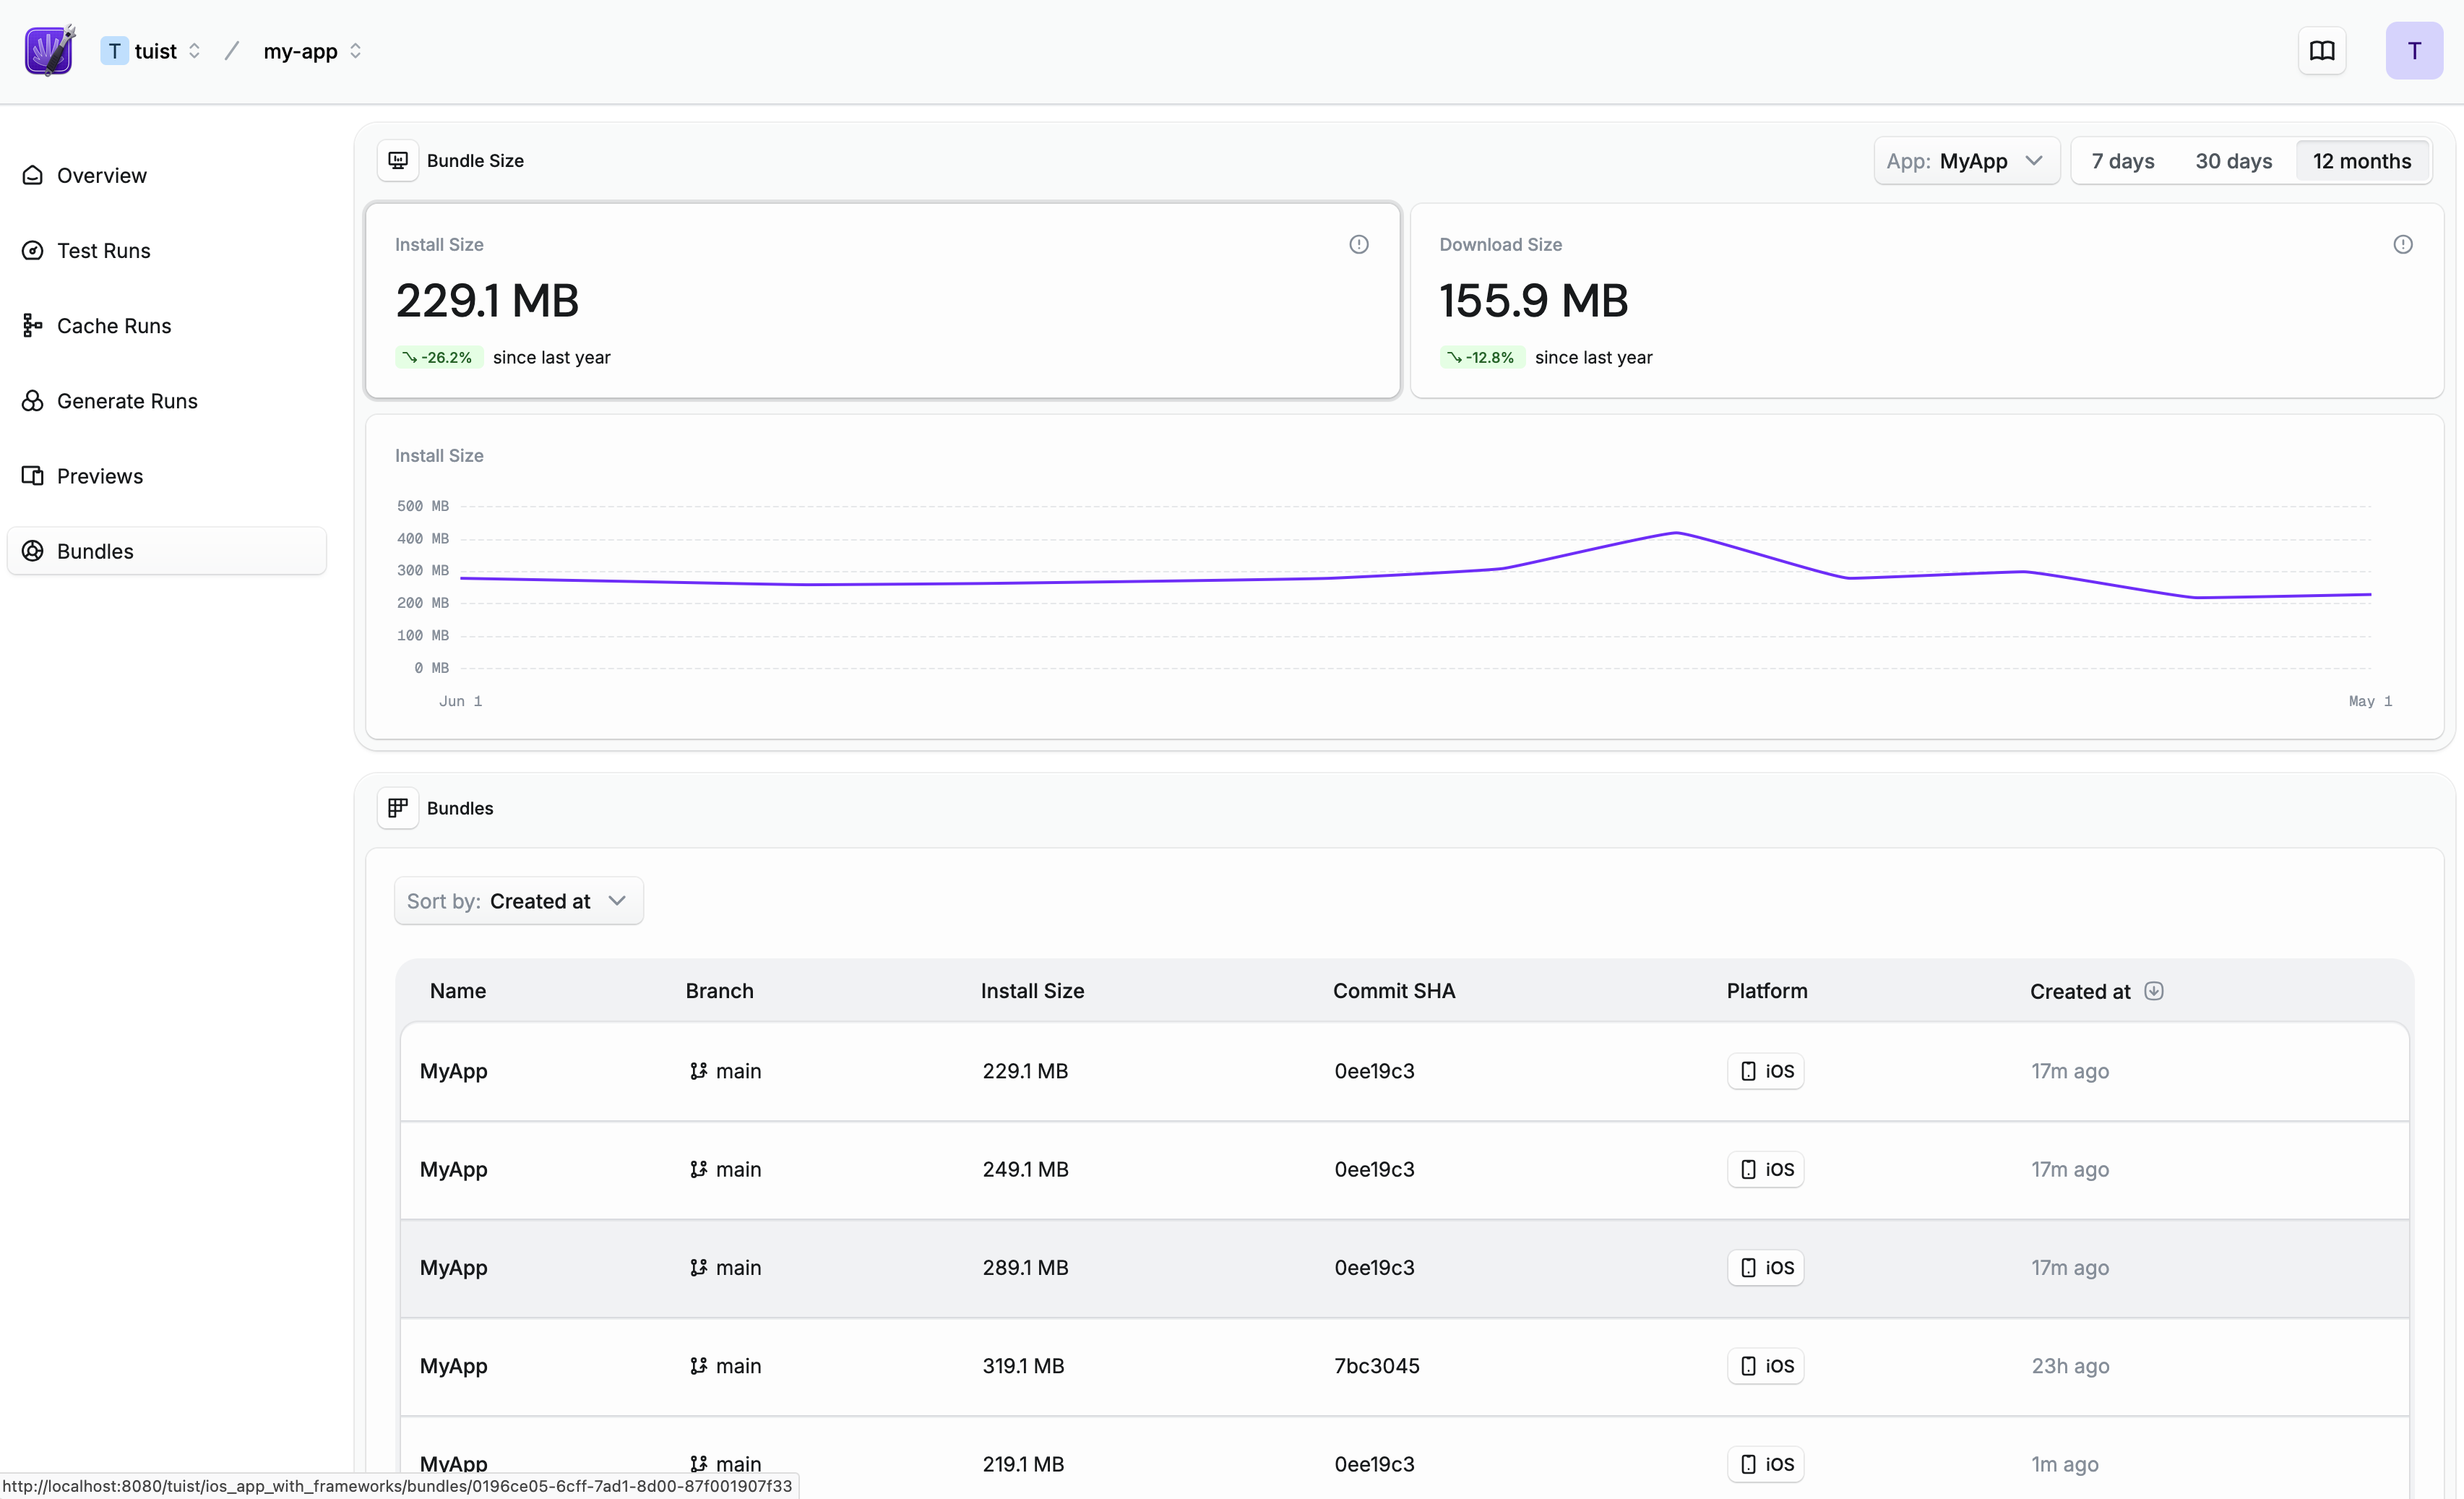
This makes it easy to spot concerning trends or celebrate optimization wins—and hold your team accountable for maintaining a reasonable app size.
Open-sourced foundations – Rosalind
We are strong believers in open source at Tuist. That's why the core of the bundle analysis is done locally using our new library, Rosalind. This library uses a standard schema with pre-defined categorization of the bundle contents. When you run tuist inspect bundle with a --json flag, you'll get the raw JSON output that comes directly from Rosalind. This is your gateway to build custom automations on top of what we offer.
We can't wait to see what you come up with Rosalind – and we're committed to maintaing and updating the Rosalind schema to help you in your efforts.
Start optimizing your bundles today
There's a lot more that we have in store for the bundle analysis, such as expanding our GitHub app to warn you directly in the PR when the bundle size significantly increases, adding more insights into how you can optimize your bundle size, and giving you the tools to make individual teams accountable for their part of the bundle size.
Bundle size isn't just about technical optimizations—it's about creating a better experience for your users and being a good platform citizen. With Tuist's bundle analysis, you now have the tools to ensure your app stays as lean as possible while still delivering all the features your users love.
Ready to get started? Run tuist inspect bundle and discover opportunities to optimize your app size!
For more details, head over to our documentation.